Environmental Engineering Reference
In-Depth Information
800
700
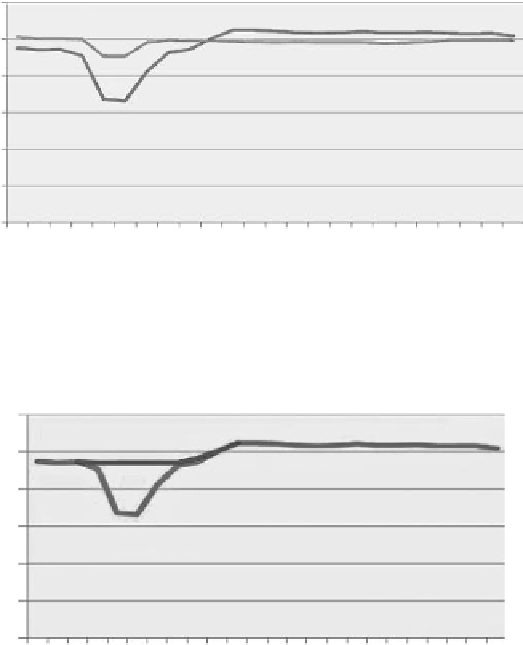
Generation on most “stable” day
of month (July 29)
600
July 2
500
400
300
200
FIGURE 2.9
Actual and projected generation at Cherokee plant.
800
700
600
500
July 2 Actual
400
300
200
FIGURE 2.10
Actual and projected generation at Cherokee plant on July 2, 2008.
Method B corrects the calculation by substituting the actual emissions on
July 2 for the estimated emissions on that date. The emission rates were actu-
ally much higher than the “stable day” rates of by Method A and reflect the
impact of cycling. Table 2.3 compares the timeframes using the emission rates
reported in the CEMS data for the July 2 wind event. Using the actual emis-
sions data yields the result that cycling Cherokee produced 6,348 lb more
SO
2
, 10,826 lb more NO
X
, and 246 fewer tons of CO
2
. Method B's limitation
is that it focuses only on emissions associated with a specific event, in this
case the activities from 3:00 and 7:00 a.m. However, the sudden decrease of
generation followed by an increase at the Cherokee plant caused emissions
variability that extended well beyond 7:00 a.m. when the plant returned to its
pre-cycle generation level. Table 2.4 depicts the additional emission impacts
because it includes generation and emission data for all of July 2.