Environmental Engineering Reference
In-Depth Information
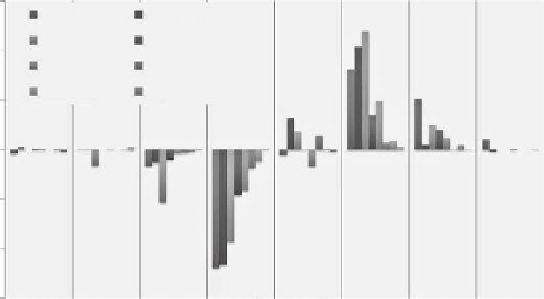
150
Cherokee
Pawnee
Hayden
Cameo
Comanche
Arapahoe
Valmont
Craig
100
50
0
-50
-100
12-1 am 1-2 am 2-3 am 3-4 am 4-5 am 5-6 am 6-7 am 7-8 am
-150
FIGURE 2.8
Hour-to-hour generation changes (MW).
to its proximity to Denver and because it appears to be cycled frequently. The
plant contains four coal-fired boilers with summer nameplate capacities of
107, 107 152, and 352 MW. In 2008, the boilers operated at 75, 72, 75, and 83%
utilization rates, respectively. Cherokee's hourly generation during this wind
event is depicted in Figure 2.9. Between 2:00 and 5:00 a.m., generation fell by
141 MW. Between 5:00 and 7:00 a.m., generation increased until it reached the
high for the day of 725 MW at 10:00 a.m. Generation remained essentially flat
from about 9:00 a.m. through the balance of the day.
The performance of the coal-fired plant on July 2 contrasts sharply with its
performance on July 29 when the system was subjected to less wind and the
plant operation was stable. The light gray line in the figure depicts hourly
generation on July 29. Although generation declined slightly in the early
morning hours on July 29, a rapid decline in generation that occurred on
July 2 is clearly not evident. The July 29 curve is shaped very similarly to the
curve for the rest of July after the wind event. Total generation on July 29 was
16,603 MWh compared to 16,445 MWh for July 2.
The first step in estimating the emission impact of the July 2 wind event
is to calculate the generation as if the event had not happened. A straight
line estimates the generation between 3:00 a.m. and 7:00 a.m. if the plant had
not been cycled (see Figure 2.10). Generation for the remainder of the day is
approximately the same as for July 29 with little wind. Wind generation on
the morning of July 2, 2008, caused Cherokee to cycle, reducing generation
by 363 MWh.
Calculating Emission Impacts
Three methods were used to estimate the emission impact of the July 2 wind
event. The simplest and most common method is to multiply the design emis-
sion rates by the generation curve without a wind event (July 29) and by the