Environmental Engineering Reference
In-Depth Information
1600
1400
1200
1000
800
600
400
200
0
120
Wind
Event
Cherokee Unit 2
April 1, 2008
100
80
60
40
Actual NO
x
Normal NO
x
Actual SO
2
Normal SO
2
20
0
EXAMPLE 2.4
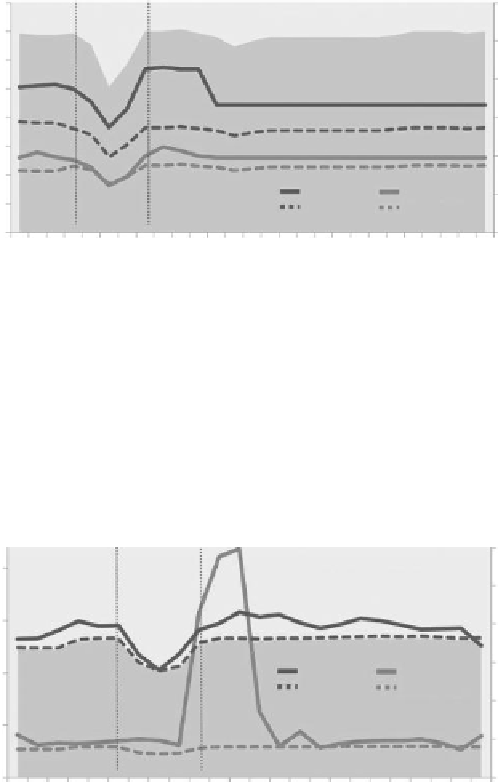
Finally, Example 2.5 depicts generation and emissions at Cherokee Unit 4
for May 2, 2008. Generation fell between 5:00 and 6:00 a.m. by 17%, then fell
another 7% before 7:00 a.m. From 7:00 to 8:00 a.m., generation rose by 4%, and
then shot up 21% by 9:00 a.m. This event produced 5,877 lb of SO
2
and 1,896
lb of NO
X
—more than the levels expected had the plant's average emission
rate for the month been achieved.
600
Wind
Event
Cherokee Unit 4
May 2, 2008
2000
500
1500
400
300
Actual NO
x
Normal NO
x
Actual SO
2
Normal SO
2
1000
200
500
100
0
0
EXAMPLE 2.5
These examples clearly show that cycling causes difficulties for emission
control equipment, and that higher-than-normal emission rates continue sev-
eral hours after a cycling event. It also appears that on occasion emission con-
trols will immediately perform to the extent that emissions initially appear
normal, yet problems occur several hours after the event. Cause and effect
cannot be determined from this data, but the frequency of these occurrences
revealed by the data suggests more than a random relationship. Finally, it is
also important to recognize that it is not possible to determine whether the
magnitude of the increase or decrease or the suddenness of the event creates

