Environmental Engineering Reference
In-Depth Information
by hourly generation to derive “normal” emission rates. Days were chosen
arbitrarily with the intent of showing the various excess emission patterns
that occur after plants are cycled.
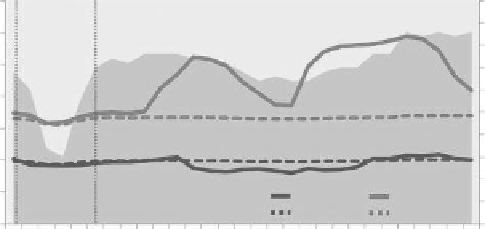
In Example 2.1 taken from the CEMS data for the Comanche Unit 1,
cycling occurred between 7:00 p.m. on August 17 and 1:00 a.m. on August 18.
Generation began to fall around 8:00 p.m.; dropped by 4% between 8:00 and
9:00 p.m.; and dropped an additional 1% between 9:00 and 10:00 p.m. After
10:00 p.m., generation began to build: 4% between 10:00 and 11:00 p.m., and
another 3% between 12:00 and 1:00 a.m. About 3 hours later, problems arose
with the SO
2
emissions controls that were not restabilized until after mid-
night. During the night of August 18, total SO
2
output was 16,464 lb higher
than if the average SO
2
emission rate had been achieved. NO
X
controls appear
to have worked well; compared to the average emission rates for the month,
the unit generated slightly lower NO
X
.
3500
3000
2500
2000
1500
1000
500
0
350
345
340
335
330
325
320
315
310
305
300
Wind
Event
Comanche Unit 1
August 18, 2008
Actual NO
x
Actual SO
2
Normal SO
2
Normal NO
x
EXAMPLE 2.1
Example 2.2 depicts Cherokee Unit 2 on December 23, 2008, and is more
extreme. Between 11:00 p.m. and midnight, generation was reduced by
11%; by 1:00 a.m., generation fell another 30%. It is important to note
that this event may well have been triggered by wind due to the sud-
den steep reduction. Also, these examples show hourly data. In reality,
these changes occur from minute to minute and may be even more sud-
den. As stressful on the equipment as the 24% reduction appears on an
hourly basis, the reduction could have been far more problematic if it
occurred over a period of a few minutes. After the large decline, produc-
tion was flat for about 4 hours, rose by 30% between 5:00 and 6:00 a.m.,
and increased another 13% before 7:00 a.m. Whether this sharp increase
occurred smoothly over an hour or happened within a few minutes can-
not be determined from the data. In this example, the control equipment
worked well: cycling induced 885 lb of additional SO
2
emissions and NO
X