Environmental Engineering Reference
In-Depth Information
14
2006
12
10
8
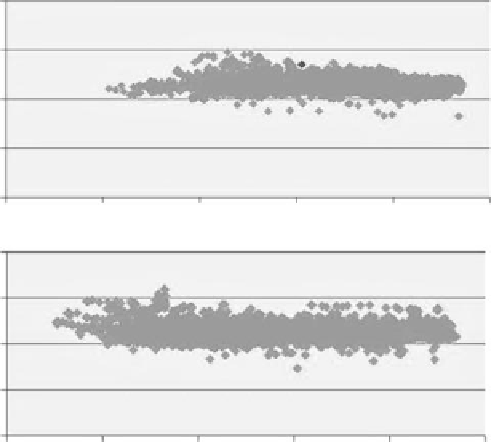
Average Heat Rate = 10.54
6
1000
1400
1800
2200
2600
3000
14
2008
12
10
8
Average Heat Rate = 10.57
6
1000
1400
1800
Hourly Generation (MW)
2200
2600
3000
Source: BENTEK Energy, CEMS
FIGURE 2.5
Comparison of heat rate versus generation across all PSCO coal plants for 2006 and 2008.
caused far greater variability in heat rate at different output levels compared
to 2006. Why is there a difference?
The only significant change in the operating environment between 2006
and 2008 arose from the addition and use of 775 MW of wind energy. A
detailed analysis in a subsequent section discussing two wind events will
show concretely how the wind changed operations at Cherokee and other
plants. However, these data indicate that cycling coal caused heat rates to
become more variable at PSCO's coal plants.
Cycling of coal facilities impacts efficiency and thus affects emissions.
To illustrate how cycling a power plant makes its operation less efficient,
think about an automobile. When driven at its designed high speed in a
high gear, it gets maximum mileage and minimizes emissions. If the driver
allows the car to slow without lowering the gear, the car operates less effi-
ciently, decreasing mileage and increasing emissions until it eventually
stalls. Conversely, driving at too high a speed for a given gear also makes
the car operate less efficiently, resulting in excessive emissions and lower
mileage.
A power plant operates in much the same way with only a single gear.
Theoretically, coal-fired plants are designed as baseload generators, meaning
they are designed to operate at a high utilization rate (typically greater