Environmental Engineering Reference
In-Depth Information
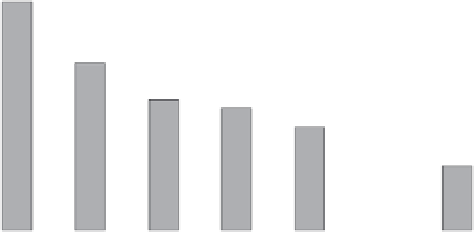
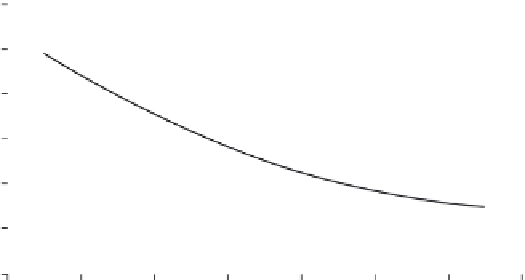
Integration Costs for Cabin Creek Sensitivity Cases
12
10
8
6
4
2
0
CC0
CC1 CC2
Case-Number of Pump-Generator Units (Base system is CC2)
CC3
CC4
CC6
FIGURE 1.3
Example of predicted wind integration cost reduction with addition of storage in Colorado.
Pumped storage sensitivity cases at 5
MMBtu gas price. (From Zavadil, R. M., (2006). “Wind
Integration Study for Public Service Company of Colorado”. Available online via National
Renewable Energy Laboratory, http://www.nrel.gov/wind/systemsintegration/pdfs/colorado_
public_service_windintegstudy.pdf (December 5, 2008)
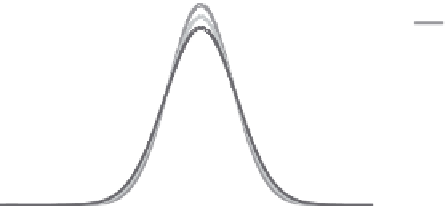
Probability Density Curves of Net Load Ramp Rate in MW/hr
for One Modeled Year
0.18%
0.16%
Current Ramp Rates
1067 MW
0.14%
0.12%
0.10%
Goblers SE Modeled
System 1547 MW
0.08%
0.06%
0.04%
Peetz NE Modeled
System 1547 MW
0.02%
0.00%
-2000 -1500 -1000
-500
0
500
1000
1500
Net Load Ramp Rate (MW/hr)
FIGURE 1.4
Probability density curves of net load ramp rate (megawatts per hour) modeled for one year
(current, Peetz, and Goblers Knob loads).
additional 480 MW wind generation and assessed for ramp rates in 1 hour.
Goblers is an 8760 load curve minus generation at the current wind systems
plus an additional 480 MW wind generation and assessed for ramp rates in
1 hour. The three curves indicate that (1) more extreme and frequent ramp-
ing occurs with more wind online; (2) the additional capacity in southeast
Colorado results in fewer ramping events and less total ramping magnitude