Biomedical Engineering Reference
In-Depth Information
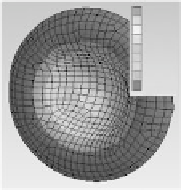
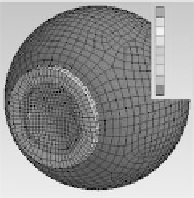
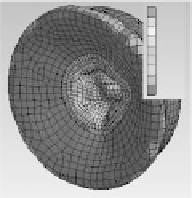
The matched simulation results are shown in Figure 21.7. The comparison of the results includes
the peak stress, peak strain, and peak deflection of the two models. Significant positive correlation
was found with the Pearson correlation test (R = 0.982 for peak stresses, R = 0.983 for peak strains,
and R = 0.996 for peak deflections). It indicates that the current eye model has the capability to pre-
dict dynamic responses to different impact loads. Table 21.3 lists the comparison of results between
the current and VT-WFU eye models.
30. 715
27. 302
23. 888
20. 477
17. 064
13. 651
10. 238
6. 8255
0
30. 715
27. 302
23. 889
20. 477
17. 064
13. 651
10. 238
6. 8255
0
a1
a2
3. 4128
3. 4128
7.4222
6.5975
5.7728
4.9481
4.1235
3.2988
2.4741
1.6494
0.82469
0
7.4222
6.5975
5.7728
4.9481
4.1235
3.2988
2.4741
1.6494
0.82469
0
b1
b2
18. 91
16. 809
14. 708
12. 607
10. 506
c2
18. 91
16. 809
14. 708
12. 607
10. 506
c1
8. 4046
8. 4046
6. 3034
6. 3034
4. 2023
4. 2023
2. 1011
0
2. 1011
0
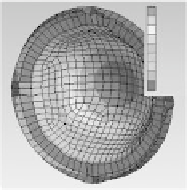
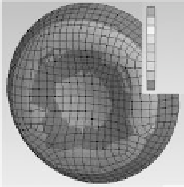
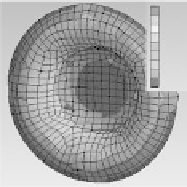
FIgure 21.7
(See color insert.)
The distribution of max principal stress of the globe in the six matched
simulations: (a) stress distribution for low (left) and high (right) speed BB simulation; (b) stress distribution
for low (left) and high (right) speed foam simulation; and (c) stress distribution for low (left) and high (right)
speed baseball simulation.
table 21.3
Comparison of results between the Current and vt-wFu eye models in matched
Simulations
Peak Stress (mPa)
Peak Strain
Peak deflection (mm)
Simulations
Current
vt-wFu
Current
vt-wFu
Current
vt-wFu
S1
23.561
22.812
0.519
0.437
6.060
6.420
S2
31.734
32.757
0.702
0.732
7.836
7.790
SF1
3.091
3.180
0.007
0.009
1.126
1.300
SF2
7.109
7.830
0.182
0.250
2.891
2.670
SB1
22.081
22.153
0.261
0.309
—
—
SB2
23.340
24.167
0.331
0.360
—
—
Correlation
R = 0.981
R = 0.977
R = 0.997


Search WWH ::

Custom Search