Biomedical Engineering Reference
In-Depth Information
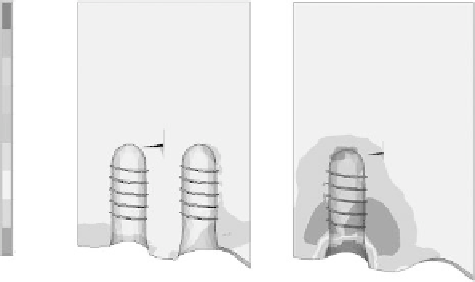
Model A
Model B
0.2
0.4
0.6
0.8
1.0
1.2
1.4
1.6
1.8
2.0
Z
Z
X
X
Y
Y
FIgure 20.6
(See color insert.)
Comparison of final results showing the variation of alveolar bone density
(g/cm
3
) under mechanical conditions. Model A: non-cantilever model; Model B: cantilever model.
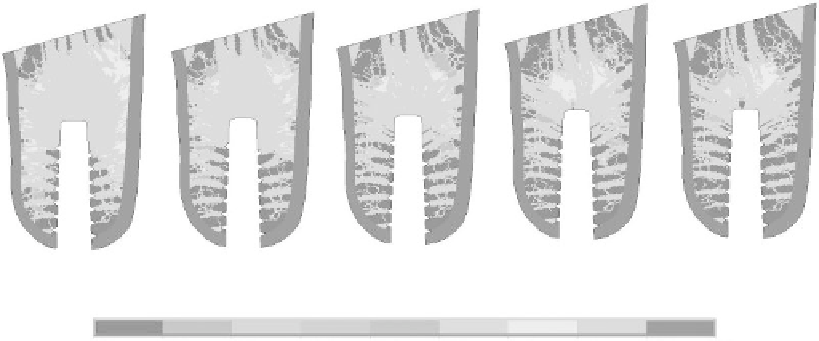
Iteration 100
Iteration 200
Iteration 300
Iteration 400
Final time
g/cm
3
0.01
0.20
0.39
0.59
0.78
0.97
1.16
1.36
1.55
1.74
FIgure 20.7
(See color insert.)
Cancellous trabeculae morphology distribution after the 100th, 200th,
300th, 400th, and final time steps. Colors represent bone mineral density, shown in g/cm
3
. Red is the cortical
bone. The total number of iteration steps for this case to achieve the converged result is 510.
state more representative of the bone's natural response. The trabecular structure adapts to its sur-
rounding mechanical environment through approximately 510 iterations. The colors from blue to red
indicate the range 0.01-1.74 g/cm
3
. Red represents the density of cortical bone whereas blue charac-
terizes the bone resorption spaces. From this figure, we can see that around the prosthetic system the
cancellous trabeculae are oriented outwards from the apex into the cortical bone. Correspondingly,
the threads are connected to the cortical bone by newly formed trabeculae. The final results presented
are very similar to the actual patterns observed in the existing literature, as shown in Figure 20.7.
20.4
model valIdatIon
20.4.1 o
rtHodontic
t
ootH
m
oVement
Various study design characteristics complicate the comparison with existing data and limit their
contribution to the clarification of related outcomes. With respect to the rotation angle of tooth
movement, during a 12-week period Yee et al. (2009) reported that the average canine rotations
Search WWH ::

Custom Search