Biomedical Engineering Reference
In-Depth Information
14.3
model FIndIngS
14.3.1 l
oadinG
a
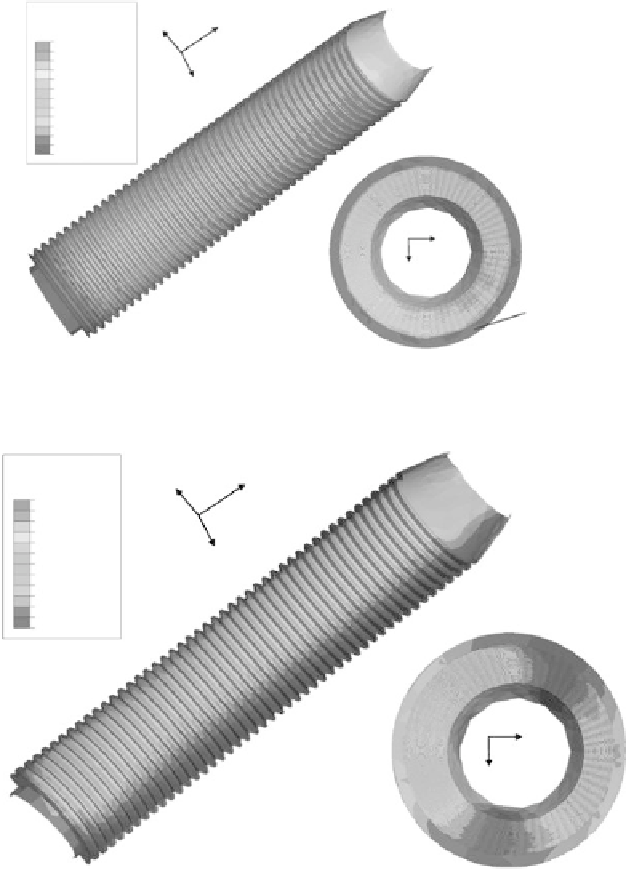
When only vertical forces were applied, the stresses on the bone adjacent to the implant were dis-
tributed quite evenly (Figure 14.2). The stresses over the entire implanted region of the bone were
in the ranges of 0.20 to 6.31 kPa/kg, 0.40 to 12.5 kPa/kg, and 0.86 to 27.7 kPa/kg, when a 200 N,
400 N, and 900 N axial force, respectively, was applied.
14.3.2 l
oadinG
B
The stress distribution on the implanted region of the bone was less uniform compared to loading
A, when the “true” forces and moments on the three axes, measured simultaneously during the
same exercises, were applied (Figure 14.3). The peak stresses in loading B in the implanted region
S, Mises (Mpa)
2.57
2.36
2.15
1.95
1.74
1.53
1.32
1.12
0.91
0.70
0.49
0.29
0.08
Peak stress:
2.57 MPa
Distal end
Section view
Distal view
FIgure 14.2
(See color insert.)
Stress distribution at the bone adjacent to the implant at loading condition A.
S, Mises (Mpa)
9.34
8.58
7.81
7.04
6.28
5.51
4.74
3.98
3.21
2.44
1.68
0.91
0.14
Peak stress:
9.34MPa
L
AP
ML
ML
AP
Section view
Distal view
FIgure 14.3
(See color insert.)
Stress distribution at the bone adjacent to the implant at loading condition B.
Search WWH ::

Custom Search