Biomedical Engineering Reference
In-Depth Information
The FE model was validated through several comparative studies. An FE simulation of a walking
mid-stance phase was conducted to compare tibiofemoral pressure with data from the cadaveric
experiment. The specimen was from a middle-aged male donor with height of 170 cm and weight of
60 kg, free from any pathology and deformity of the lower extremity. A medial parapatellar approach
to the knee was used to expose the tibiofemoral articular surfaces, which allowed sub-femoral inser-
tion of the K-Scan pressure sensors (Tekscan Inc., Boston, Massachusetts). The tendons were sepa-
rated for muscle loading. A material testing unit (Bose Inc., Eden Prairie, Minnesota) was used for
compression tests. The FE model was also assigned plantar pressure boundary conditions recorded
with an in vivo F-Scan (Tekscan Inc.). The FE-predicted pattern of plantar pressure in mid-stance
was compared with the F-Scan data for validation.
12.3.3 f
finite
e
lement
p
redictionS
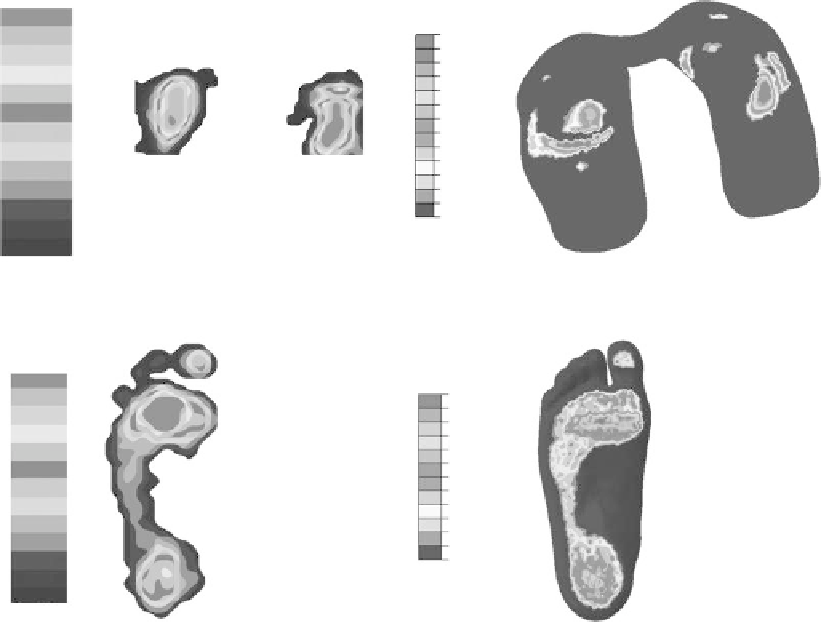
Figure 12.3 depicts the tibiofemoral pressure and plantar pressure distribution obtained from
cadaveric experiments and FE simulations using a flat insole in mid-stance. The K-Scan measure-
ment of peak tibiofemoral contact pressure during mid-stance was 3.67 MPa (Figure 12.3a). The
FE-predicted peak contact pressure was 3.89 MPa (Figure 12.3b), which was comparable with the
cadaveric data. The contact area predicted by the FE model was approximately 477.0 mm
2
, com-
pared with 491.4 mm
2
from the K-Scan measurement. Loading transmitted through the menisci was
obvious in the FE predictions at the exterior borders of both the medial and lateral compartments
of the femoral cartilage but could not be observed in the K-Scan results because of the limited size
MPa
MPa
>=
3.67
3.37
3.06
2.76
2.45
2.14
1.84
1.53
1.22
0.92
0.61
0.31
8.82
3.98
3.65
3.32
2.99
2.65
2.32
1.99
1.66
1.33
1.00
0.66
0.33
0.00
>=
0.00
(a)
(b)
MPa
MPa
>=
0.12
0.15
0.11
0.14
0.10
0.12
0.09
0.11
0.10
0.08
0.09
0.07
0.07
0.06
0.06
0.05
0.05
0.04
0.04
0.03
0.02
0.01
0.02
0.00
0.01
>=
0.00
(c)
(d)
FIgure 12.3
(See color insert.)
Model validation: (a) tibiofemoral pressure measured by K-Scan; (b) FE
predicted tibiofemoral pressure; (c) plantar pressure measured by F-Scan; (d) FE predicted plantar pressure.
Search WWH ::

Custom Search