Database Reference
In-Depth Information
1
App Engine Datastore 1 Byte
App Engine Datastore 100 Byte
App Engine Datastore 1KByte
App Engine Datastore 1MByte
Azure Table Storage 1 Byte
Azure Table Storage 100 Byte
Azure Table Storage 1KByte
Azure Blob Storage 1MByte
Amazon LocalDB 1 Byte
Amazon LocalDB 100 Byte
Amazon LocalDB 1KByte
Amazon SimpleDB 1 Byte
Amazon SimpleDB 100 Byte
Amazon SimpleDB 1KByte
Amazon S3 1MByte
0.9
0.8
0.7
0.6
0.5
0.4
0.3
0.2
0.1
0
10
−
2
10
−
1
10
0
10
1
10
2
10
3
10
4
10
5
10
6
10
7
10
8
Speed (Byte/Second)
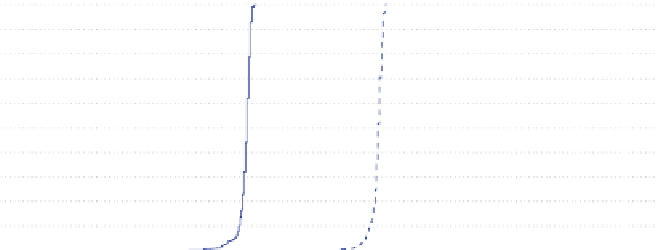
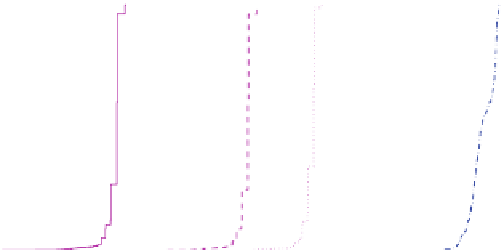
Fig. 4.9
The cumulative distribution function of read throughput in cloud databases with low
stress database read test set
1
App Engine Datastore 1 Byte
App Engine Datastore 100 Byte
App Engine Datastore 1KByte
App Engine Datastore 1MByte
Azure Table Storage 1 Byte
Azure Table Storage 100 Byte
Azure Table Storage 1KByte
Azure Blob Storage 1MByte
Amazon LocalDB 1 Byte
Amazon LocalDB 100 Byte
Amazon LocalDB 1KByte
Amazon SimpleDB 1 Byte
Amazon SimpleDB 100 Byte
Amazon SimpleDB 1KByte
Amazon S3 1MByte
0.9
0.8
0.7
0.6
0.5
0.4
0.3
0.2
0.1
0
10
−
2
10
−
1
10
0
10
1
10
2
10
3
10
4
10
5
10
6
10
7
10
8
Speed (Byte/Second)
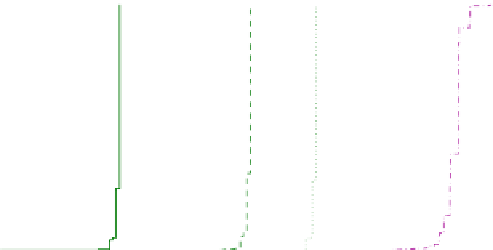
Fig. 4.10
The cumulative distribution function of write throughput in cloud databases with low
stress database write test set
1
Amazon Local DB Read
Amazon Simple DB Read
Azure Storage Read
App Engine Datastore Read
Amazon Local DB Write
Amazon Simple DB Write
Azure Storage Write
App Engine Datastore Write
0.9
0.8
0.7
0.6
0.5
0.4
0.3
0.2
0.1
0
10
1
10
2
10
3
10
4
10
5
10
6
Speed (Byte/Second)
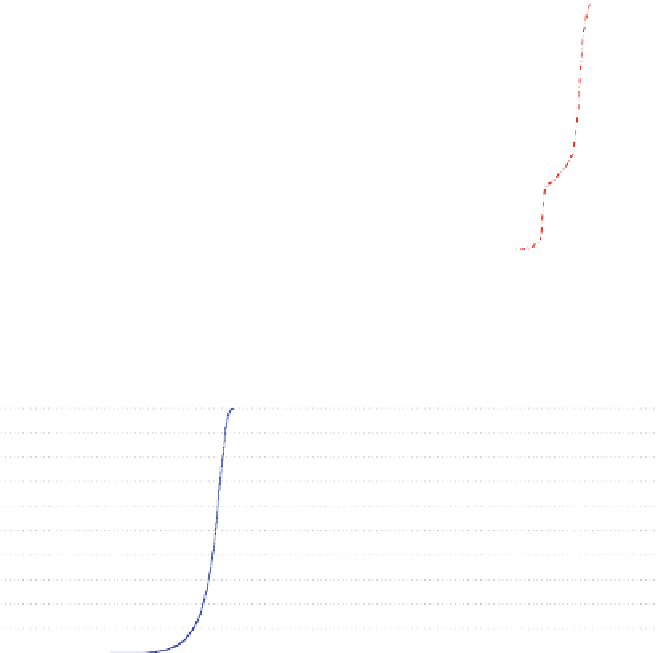
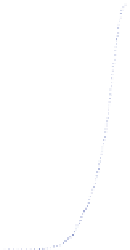
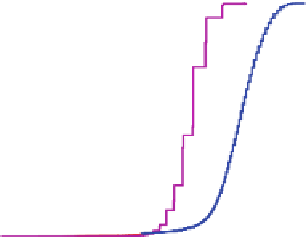
Fig. 4.11
The cumulative distribution function of read and write throughput in cloud databases
with high stress database read and write test sets