Database Reference
In-Depth Information
1
300 requests
900 requests
1500 requests
2100 requests
2700 requests
3300 requests
0.9
0.8
0.7
0.6
0.5
0.4
0.3
0.2
0.1
0
10
2
10
3
10
4
10
5
10
6
Connection Time on Client Side (Milliseconds)
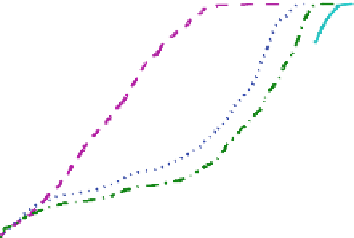
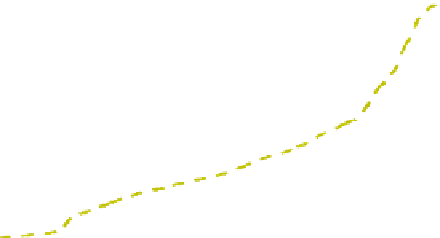
Fig. 4.4
The cumulative distribution function of high stress round-trip between the end-user and
the Amazon EC2 cloud hosting servers
1
300 requests
900 requests
1500 requests
2100 requests
2700 requests
3300 requests
0.9
0.8
0.7
0.6
0.5
0.4
0.3
0.2
0.1
0
10
2
10
3
10
4
10
5
10
6
Connection Time on Client Side (Milliseconds)
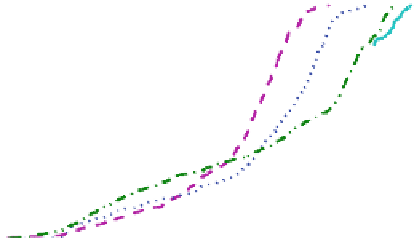
Fig. 4.5
The cumulative distribution function of high stress round-trip between the end-user and
the Microsoft Windows Azure cloud hosting servers
time of Amazon EC2 in Fig.
4.4
and Microsoft Windows Azure in Fig.
4.5
are
dramatically increased at 1,500 requests and 900 requests respectively. For Google
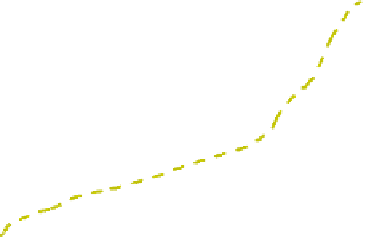
App Engine in Fig.
4.6
, although the response time shows an increasing trend, there
is no significant leap between neighboring groups of requests.
The reason for these observations could be explained from the scalability aspect.
If response time increases steadily and linearly under stress in Google App Engine,
there is certainly some good scalability capability as its cloud hosting server is
thread based, allowing more threads to be created for additional requests. Never-
theless, the cloud hosting servers of Amazon EC2 and Microsoft Windows Azure
are instance based. The computing resources for one instance are preconfigured and
more resources for additional requests cannot be obtained unless extra instances are
deployed.