Agriculture Reference
In-Depth Information
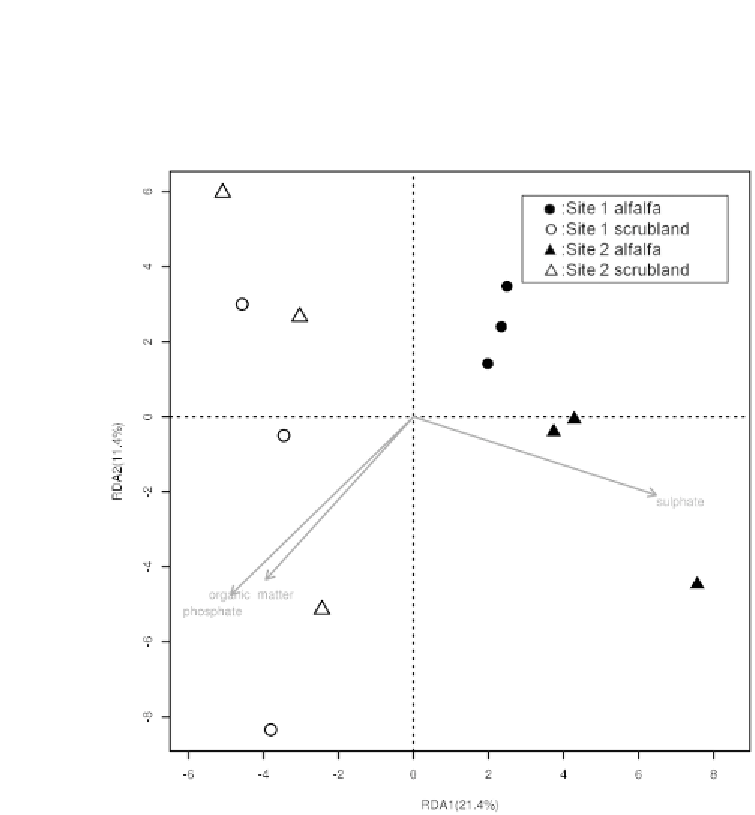
FIGURE 2:
Redundancy analysis of the effect of discriminative soil parameters on
bacterial communities using the PhyloChip data. Numbers in brackets indicate the percent
of the total variance explained by each axis. Only these soil parameters which significantly
(p<0.05 by 1000 times permutation tests) explained the bacterial community variation was
shown.