Database Reference
In-Depth Information
Finally, the procedure identifies the segments that contain the selected
legs (Figure 10) and computes their similarity to the pattern. If the simi-
larity is above a given threshold
the procedure outputs the segment as
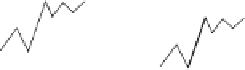
a match. In Figure 11, we give an example of a stock-price pattern and
similar segments retrieved from the stock database.
T,
1.6
1.4
1.2
1.0
0.8
0.6
1.6
1.4
1.2
1.0
0.8
0.6
vl
= 0.6
vr
= 1.4
il
= 9
ir
=15
ratio
= 2.33
length
= 6
vl
= 0.6
vr
= 1.4
il
= 9
ir
=15
ratio
= 2.33
length
= 6
vl
= 1.6
vr
= 1.0
il
= 21
ir
= 27
ratio
= 0.62
length
= 6
vl
= 1.6
vr
= 1.0
il
= 21
ir
= 27
ratio
= 0.62
length
= 6
0 5 10 15 20 25
0 5 10 15 20 25
30
30
time
time
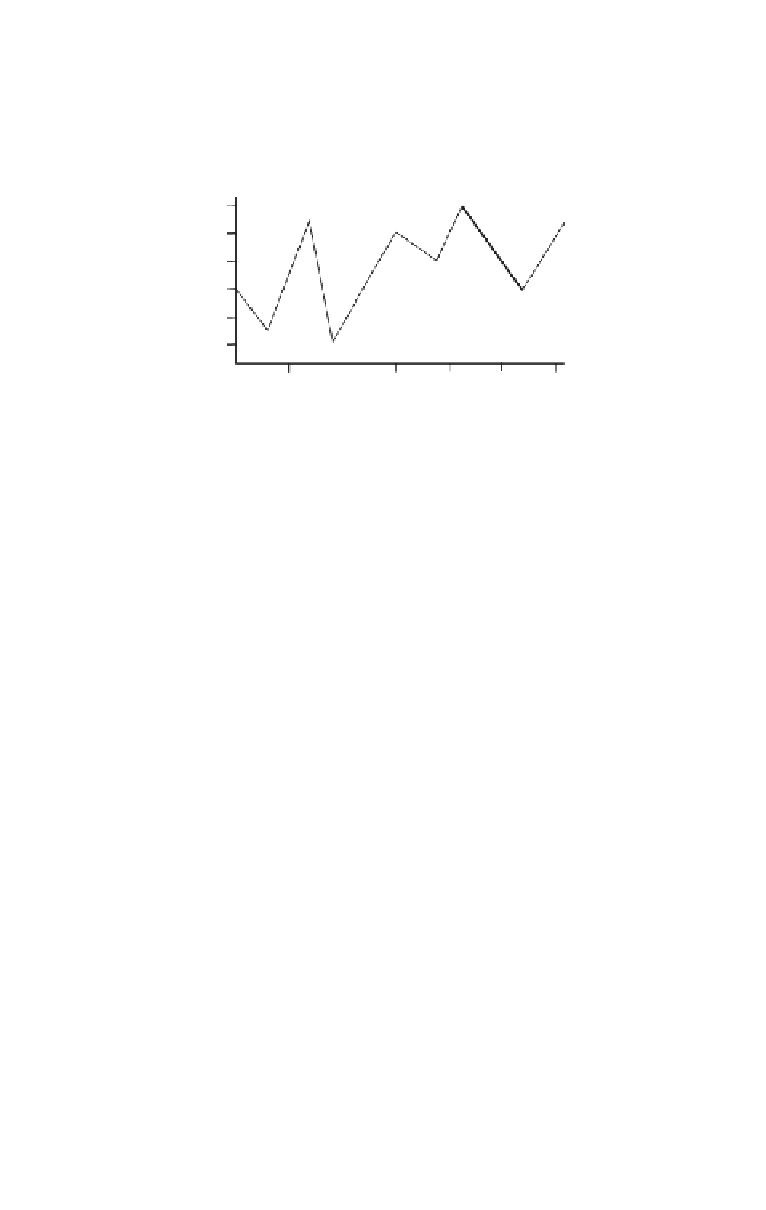
Fig. 8.
Example legs. We show the basic data for the two legs marked by thick lines.
PATTERN-RETRIEVAL
The procedure inputs a pattern series and searches a time-series
database; the output is a list of segments from the database that match
the pattern.
Identify the pattern leg
p
with the greatest endpoint ratio, denoted
ratio
p
. Deter-
mine the length of this pattern leg, denoted
length
p
.
Find all legs in the database that satisfy the following conditions:
•
their endpoint ratios are between
ratio
p
/C
and
ratio
p
· C
, and
•
their lengths are between
length
p
/D
and
length
p
· D
.
For each leg in the set of selected legs:
Identify the segment corresponding to the pattern (Figure 10).
Compute the similarity between the segment and the pattern.
If the similarity is above the threshold
T
, then output the segment.
Fig. 9. Search for segments similar to a given pattern. We use three parameters to con-
trol the search: maximal ratio deviation
C
, maximal length deviation
D
, and similarity
threshold
T
.
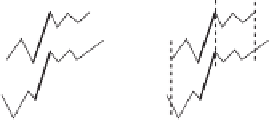
(a) Prominent
leg in a pattern.
(b) Similar leg
in a series.
(c) Align the right
end of these legs.
(d) Identify the respective
segment in the series.
Fig. 10.
Identifying a segment that may match the pattern.