Database Reference
In-Depth Information
Case 1
Case 2
1.2
1.2
1
1
0.8
0.8
0.6
0.6
0.4
0.4
0.2
0.2
0
0
0
50
100
150
200
250
300
350
400
0
50
100
150
200
250
300
350
400
1
1
0.5
0.5
0
0
-0.5
-0.5
-1
-1
0
50
100
150
200
250
300
350
400
0
50
100
150
200
250
300
350
400
1
1
0.8
0.8
0.6
0.6
0.4
0.4
0.2
0.2
0
0
0
50
100
150
200
250
300
350
400
0
50
100
150
200
250
300
350
400
1
1
0.8
0.8
0.6
0.6
0.4
0.4
0.2
0.2
0
0
0
50
100
150
200
250
300
350
400
0
50
100
150
200
250
300
350
400
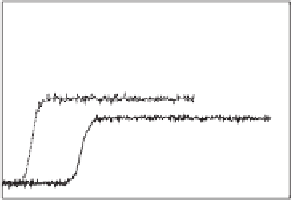
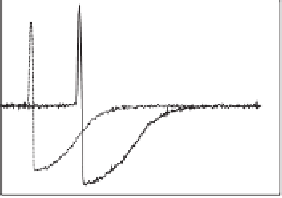
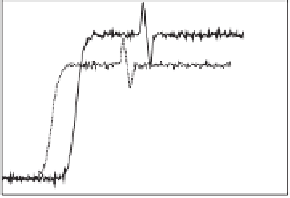
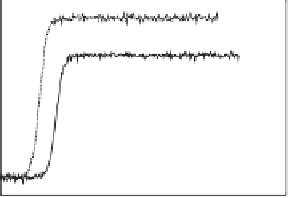
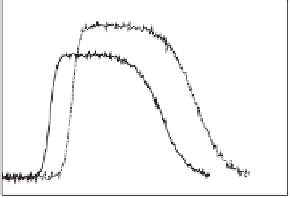
Fig. 7. Trace data set. Each example is composed by four variables, and each variable
has two possible behaviors. In the graphs, two examples of each behavior are shown.