Database Reference
In-Depth Information
(A) O
RIGINAL
D
ATA
S
ET
error/number of literals
error/series length percentage
30
80
points
intervals
points
intervals
70
25
60
20
50
15
40
30
10
20
5
10
0
0
0
10
20
30
40
50
60
70
80
90
100
0
10
20
30
40
50
60
70
80
90
100
(B) V
ARIABLE
L
ENGTH
D
ATASET
error/number of literals
error/series length percentage
30
80
points
intervals
points
intervals
70
25
60
20
50
15
40
30
10
20
5
10
0
0
0
10
20
30
40
50
60
70
80
90
100
0
10
20
30
40
50
60
70
80
90
100
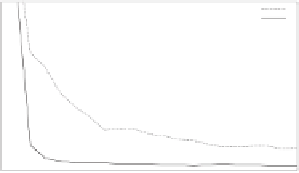
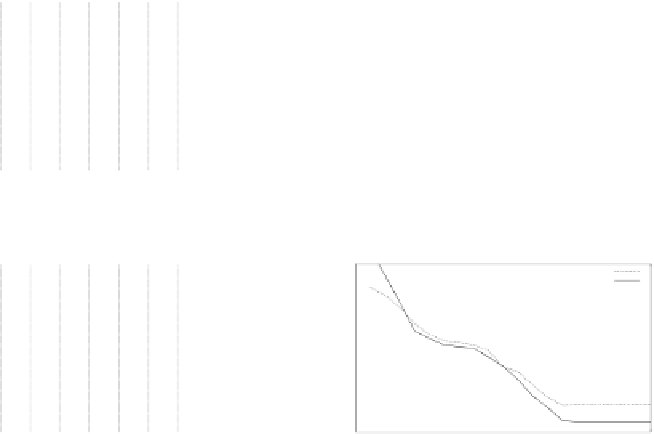
Fig. 6.
Error graphs for the
Control
data set.
Table 7.
Results for the
Control
data set.
10
20
30
40
50
60
70
80
90
100
Error/Number of literals
Points
20.83
13.83
9.50
7.33
6.50
5.50
4.67
4.17
4.33
4.00
Intervals
4.50
1.67
1.33
1.17
1.17
1.00
1.00
1.00
0.83
0.83
Error/Series length percentage
Points
63.17
54.00
48.00
46.17
45.00
42.17
28.50
11.67
4.67
4.00
Intervals
87.00
56.17
45.17
47.00
41.33
34.33
6.67
1.00
0.67
0.83
Table 8.
Results for the
Control-Var
data set.
10
20
30
40
50
60
70
80
90
100
Error/Number of literals
Points
30.33
22.83
15.83
15.17
13.00
13.67
12.83
12.50
13.17
13.00
Intervals
6.50
6.50
6.00
5.50
5.83
5.67
5.33
5.33
5.50
5.00
Error/Series length percentage
Points
65.00
51.67
43.67
41.50
31.00
22.50
12.83
13.00
13.00
13.00
Intervals
74.67
48.17
41.50
40.00
31.33
17.17
5.50
5.00
5.00
5.00