Information Technology Reference
In-Depth Information
(1-7) semantic differential scale 6.8. Satisfying experiences are differentiated from
dissatisfying ones.
Impact
0
−
3
=
|
Satisfaction
1
−
7
−
4
|
(6.8)
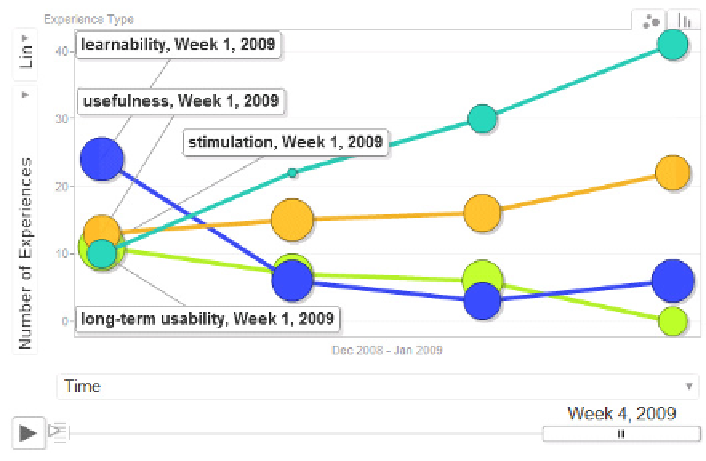
One may note that experiences related to learnability are the most dominant ex-
periences during the first week. These experiences sharply decrease in the second
week while the number of experiences relating to long-term usability and usefulness
constantly increase over the four weeks of the study. Experiences related to stimu-
lation seem to be the most impactful experiences during the first week followed by
experiences of learnability. Surprisingly, experiences relating to long-term usability
seem to be the least impactful despite their dominance over time. This finding did
not become apparent in the initial analysis described in chapter 4 as the relation be-
tween time and impact of experiences was not explored. Visualization tools like the
one illustrated in figure 6.5 enable rapid hypothesis construction and testing in the
exploration of such data.
A different visualization, displayed in figure 6.6, can provide insights into the
relations between
product qualities
(rows) and
product features
(columns, see table
6.4). Each cell in the matrix depicts the percentage of experiences referring in at
least one instance to the respective product quality and product feature out of the to-
tal list of experience narratives that refer to the given feature (i.e. every column adds
up to 100%). The researcher may for instance obtain insights into the overall expe-
rience of a given feature through the distribution of experiences over the five types,
Fig. 6.5
Visualizing frequency of experiences (y axis) and average impact (size of circle) for
four types of experiences colored differently over the four weeks of the study


Search WWH ::

Custom Search