Database Reference
In-Depth Information
Server status verification
These statistics reflect the MySQL server's total activity, including (but not limited to)
the activity generated by queries sent from phpMyAdmin.
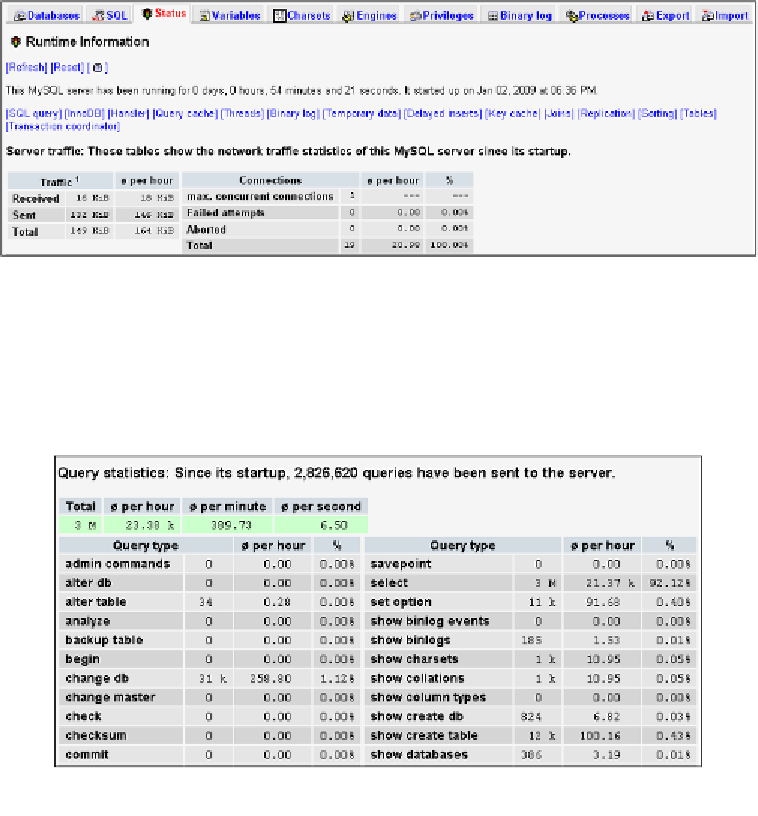
The general status page
Clicking the
Status
link produces runtime information about the server. The page
has several sections. First, we get information about the elapsed running time and
the startup time. Then we get the total and average values, for traffic and connections
(where the
ø
means average).
Next, the statistics about the queries are displayed (shown in part here). The average
number of queries per hour, minute, and second give a good indication of the
server load.
This is followed by statistics about each MySQL command, the absolute number of
times, hour average, and the number of times as a percentage of the total.

Search WWH ::

Custom Search