Agriculture Reference
In-Depth Information
Table 5.2 Main livelihoods' sources as identified by household heads
in urban Malawi
Description
n
UA
Rural
agriculture
Business
Formal
employment
Informal
employment
Lilongwe
165
9.7
4.8
17.6
66.7
1.2
Blantyre
165 24.8
4.8
13.9
53.9
2.4
Low-income households
120 42.5
2.5
25.8
25.8
3.3
High-income households 210
2.9
6.2
10.0
80.0
1.0
Female-headed
households
87 55.2
3.4
17.2
24.1
0.0
Male-headed households 243
3.7
5.3
15.2
73.3
2.5
All households
330 17.3
4.8
15.8
60.3
1.8
Despite this low rating of UA, considerable variation between groups was
observed. For example, while UA contributed 9 per cent of high-income
households' livelihoods, it provided 42.5 per cent of low-income households.
Thus, low- and high-income households are statistically different (P
<
0
:
05),
as shown in Table 5.2.
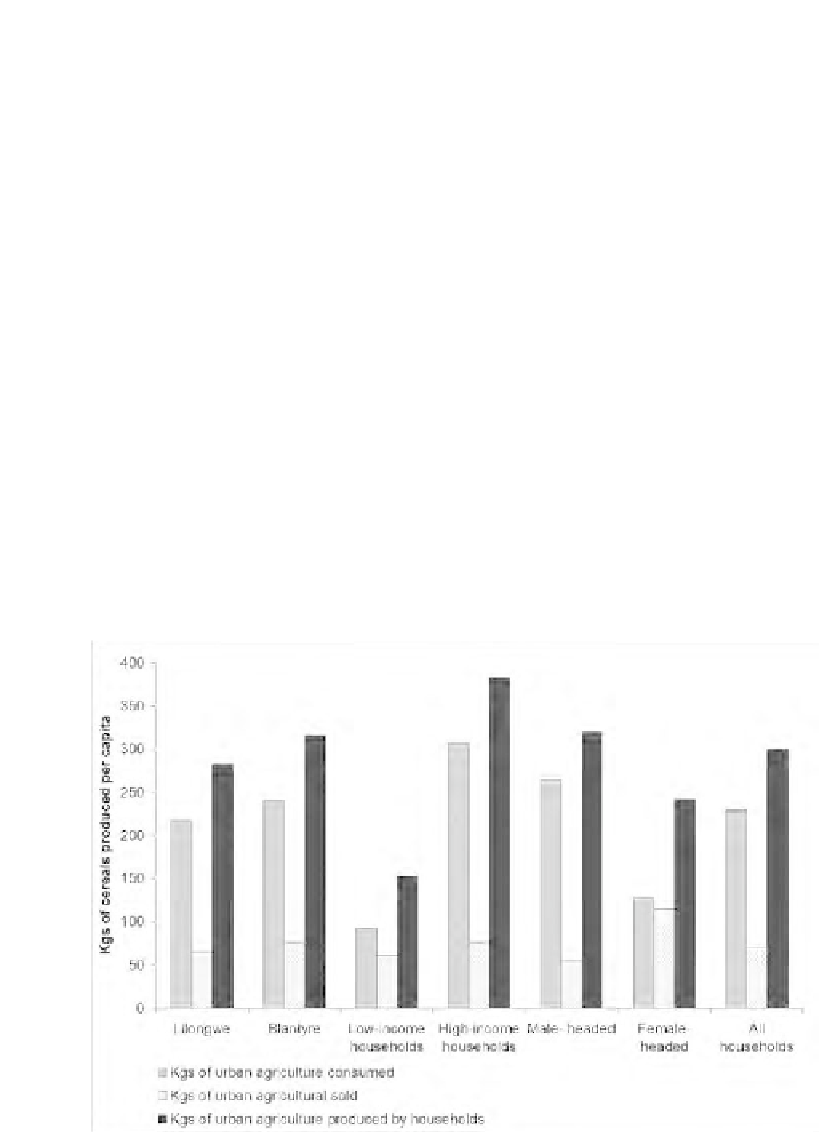
Results presented in Figure 5.2 show that high-income households were more
productive in terms of the amount of food they produce than lower-income
Figure 5.2 Average cereal equivalents (expressed in kilograms per member of
each household per year) from UA