Agriculture Reference
In-Depth Information
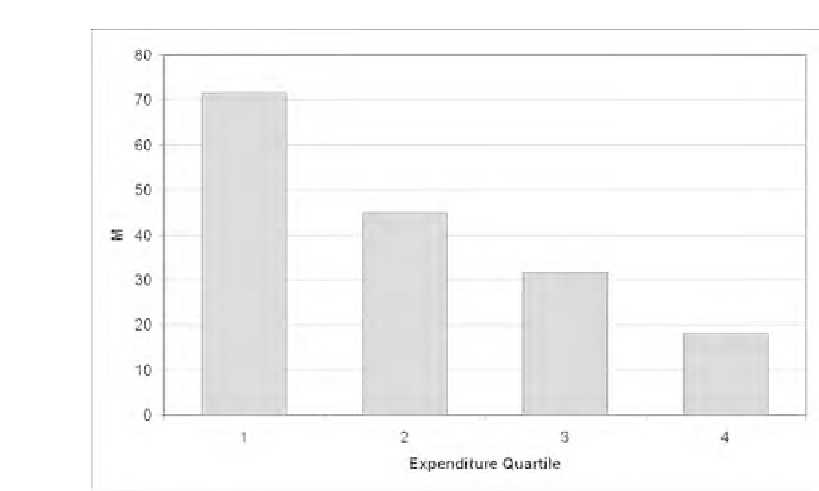
Figure 4.1 Average share of total budget allocated to food, by
expenditure quartile
Deaton, 1997). As income increases, the percentage of the household budget
allocated to food falls.
Harare urban diets were shown to be more varied than rural diets
(ZIMVAC, 2003), with tubers and cereals dominating (62.2 per cent),
followed by meat and fish (13.7 per cent), then by fats, oils and vegetables
(15.7 per cent). Expenditure-reduction strategies included cutting spending on
consumption and purchases mainly by
curtailing money
spent on
transportation and health care to make ends meet.
Objective 4: Factors associated with food security and
energy adequacy
The results of the energy adequacy regression using household calories per
adult equivalence unit are given in Table 4.6. Adjusted R
2
was 0.487, meaning
48.7 per cent of the variation in energy adequacy is explained by the given
independent variables. The Durbin-Watson statistic was 1.653. This suggests
that there is a slight positive correlation between adjacent residuals, since the
value is close to 2, signifying that the residuals are uncorrelated. This was also
confirmed prior to moving on to regression analysis, where residuals were
independent of each other.
Some variables showed a significant link with household energy adequacy.
Practising UA was found to be related to energy adequacy. This is consistent
with a number of earlier studies on UA (Mbiba, 1995; Mutangadura and
Makaudze, 1999; Mwakiwa, 2004; Mudimu et al, 2005). Correlations also