Geology Reference
In-Depth Information
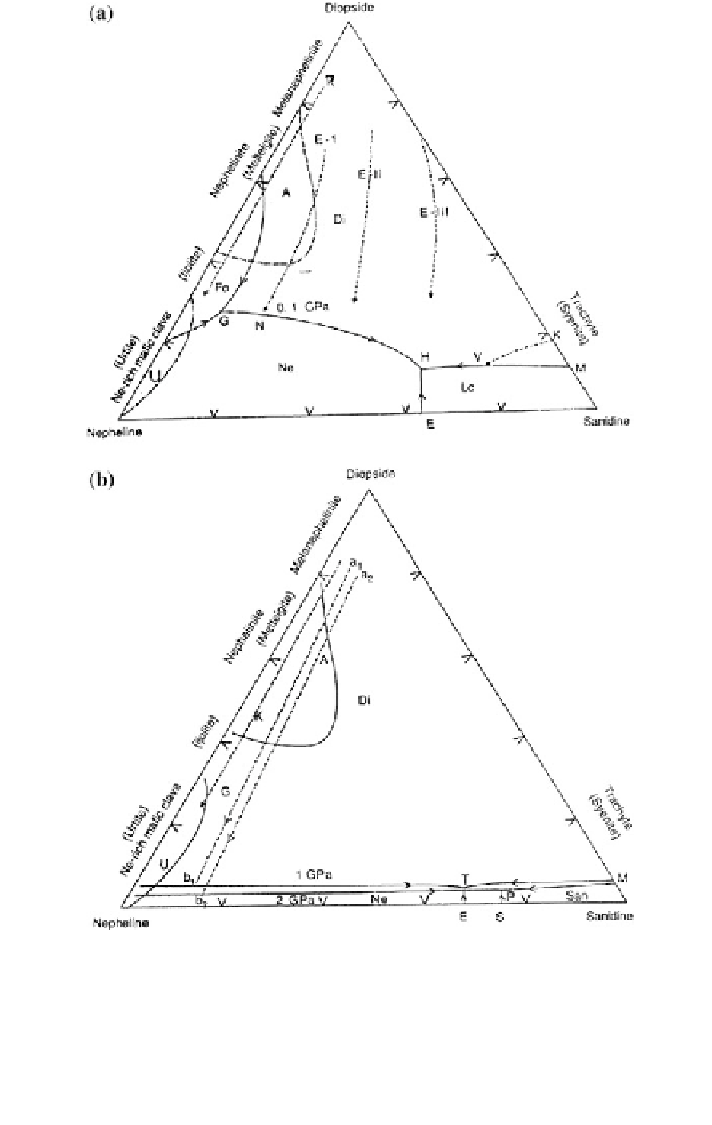
Fig. 9.6 a Normative composition of phonolites (Nkoumbou et al. 1995), nephelinites (Le Bas
1977, area A), urtites (Le Bas 1977; area U) and trachytes (Nkoumbou et al. 1995; among K
V)
from various localities all over the world. The trends marked E-I, E-II and E-III are those of Etinde
nephelinites (Nkoumbou et al. 1995). The curve K
-
V is the trend shown by the trachytic lava from
the same locality (Nkoumbou et al. 1995). The shaded area corresponds to nephelinite; the dotted
area represents pyroxene-poor nepheline-rich volcanic rocks (urtite). Trend K corresponds to
crystallization path of phonolites from Kenya rift valley. b Trend of crystallization of nephelinitic
liquids at 1 and 2 GPa from initial bulk compositions a1 and a2, respectively. The shaded and
dotted area represent composition corresponding to nephelinites and pyroxene-poor, nepheline-
-
Search WWH ::

Custom Search