Environmental Engineering Reference
In-Depth Information
• Commercial use
• Livestock
• Mining
• Electricity production
• Wastewater treatment
In 2000, people in the United States used an average of 407.5 billion gallons of water per
day. Of this total amount, 79% or 323 billion gallons was from a surface water source and
21% or 84.5 billion gallons originated from groundwater (USGS 2004). Over the last 50
years, the usage of water for electricity production increased by more than 500% and, since
1965, has been the category of highest water use. Water used for irrigation purposes has
also risen 50% between 1950 and 2000—another significant increase.
From 1970 to 2000, the use of fresh surface water in the United States has remained rela-
tively constant at a usage rate of approximately 275 billion gallons of water per day. During
this same time period, the use of fresh groundwater has increased from approximately
65 billion to 85 billion gallons of water per day (USGS 2009b). In many states, groundwa-
ter is the key source of potable water for irrigation; Nebraska, Texas, and California are
examples. Some states, such as California, have designated specific areas for
groundwater
recharge
. Here, during the short rainy season, surface water seeps into the ground and is
stored until it is needed for human use during dryer periods.
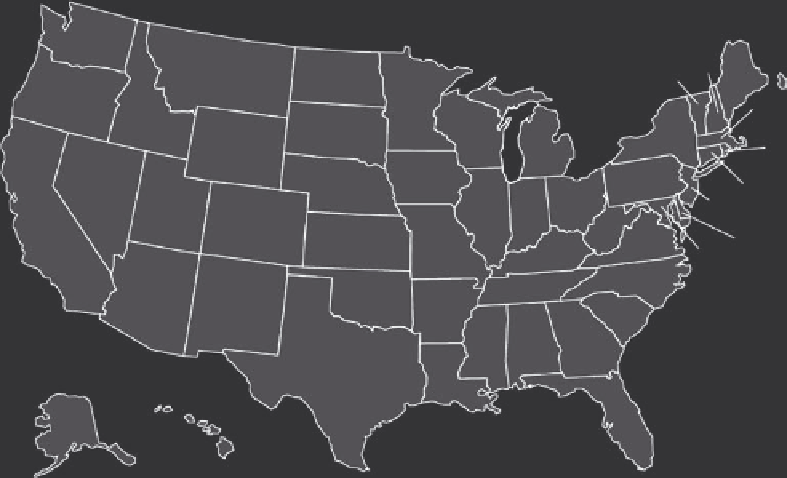
Figure 3.7 shows the percent of population in each state using groundwater as a source
of drinking water. Over 90% of the people in Idaho, New Mexico, Mississippi, and Florida
use groundwater for this purpose. By contrast, the populations of Colorado, Rhode Island,
and Kentucky obtain less than 30% of their drinking water from groundwater (USGS 2004).
WA
61
NH
61
VT
64
ME
60
MT
52
ND
57
OR
40
MN
80
MA
46
ID
96
WI
70
SD
70
NY
35
WY
57
MI
46
RI
26
IA
78
PA
41
NV
31
NE
87
CT
54
IN
64
OH
46
NJ
53
IL
33
UT
56
CO
22
WV
43
CA
45
VA
34
KS
51
DE
66
MO
54
KY
24
MD
31
NC
50
AZ
60
TN
47
OK
34
NM
90
AR
53
SC
45
MS
92
GA
41
AL
52
Explanation
TX
45
60
LA
61
Estimated percentage of
population in a state
using groundwater as
drinking water in 1995
FL
93
AK
62
HI
94
FIGURE 3.7
Groundwater use by state. (From Alley, W.M. et al.,
Sustainability of Groundwater Resources
, United States
Geological Survey Circular 1186, Denver, CO, 1999.)
Search WWH ::

Custom Search