Environmental Engineering Reference
In-Depth Information
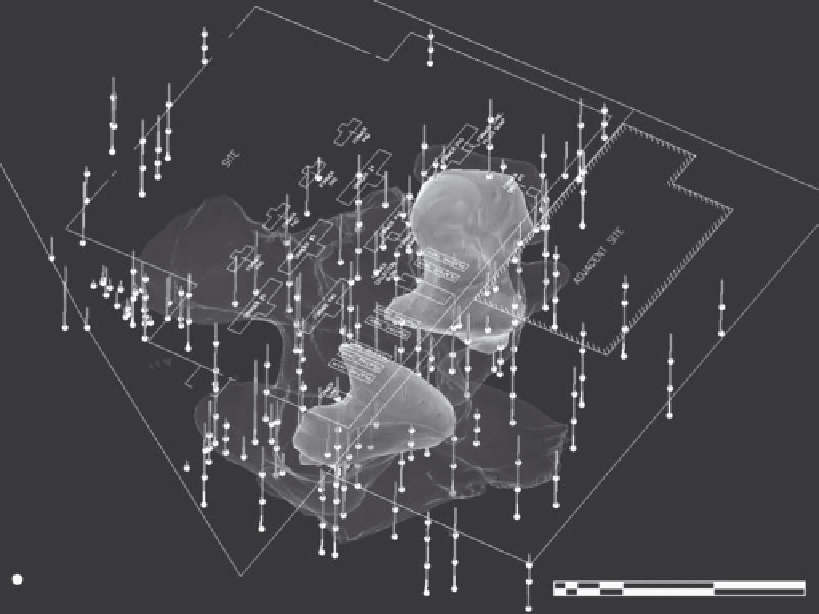
Legend
Sample locations
Scale (m)
Vertical scale is exaggerated by a factor of 4
0 4
12
28
44
FIGURE 14.11
(See color insert.)
Three-dimensional map view showing soil boring locations, source areas, extent and
magnitude of on-site and off-site CrVI impacts (darker color indicates higher concentration).
the chromium plumes shown in Figure 14.10 is about 3 m (10 ft), indicating the chromium
VI did not migrate significantly downward. This lack of migration occurred because the
site is not within a geologically vulnerable area; it is located in an area of thick lacustrine
deposits composed of clay. Since there is little or no groundwater present in this subsur-
face zone, a synergistic effect was not realized.
During the development of the site, a large amount of fill material was placed beneath
the building, paved areas, and along building footings. The fill material consisted of sand
and gravel that subsequently became water saturated and aided in spreading the con-
tamination once released. Contamination did not extend to depths greater than 5 m (15 ft)
beneath the surface of the ground (Figure 14.10) and traveled approximately 15 m (50 ft)
beyond the release points shown in Figure 14.11.
Although the groundwater present at the site was anthropogenic in origin, it took a net-
work of monitoring wells to arrive at this conclusion. As with Case Study 1, no detailed
urban geologic map had been prepared for the urban region containing the site. By pro-
viding information concerning the distribution, stratigraphy, and hydrology of the shal-
low unconsolidated sediments, the urban geologic map would have reduced monitoring
well-drilling costs.
The cost of remediation exceeded $1 million, with the lack of any completed contaminant
pathways and a geologic environment consisting of clay helping to keep the costs down.
Because the contamination was shallow and the buildings were demolished, excavation
Search WWH ::

Custom Search