Environmental Engineering Reference
In-Depth Information
Q
L
I
H
M
B
M
M
K
F
R
I
M
I
O
M
J
I
I
I
G
A
I
M
M
M
D M
I
I
A
I
C
O
E
B
A
I
M
P
N A
Scale in meters
0
15
30
60
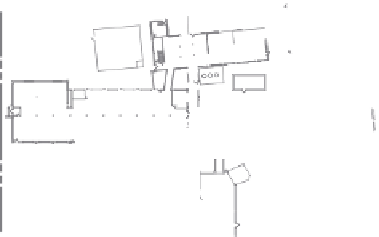
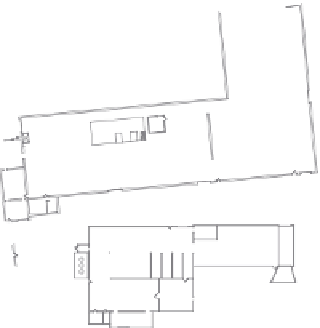
FIGURE 14.4
Identified RECs (each REC appears as a letter inside a circle).
vertical relationships to be emphasized without any negative impact on the generally
understood shape of the surface in question. Figure 14.7 shows
high-resolution aquifer
proiling
—a 3D cross section of the site and adjacent areas depicting at least three DNAPL
contaminant plumes.
The 3D map and graph combination shown in Figure 14.7 provides additional informa-
tion relevant to the remediation effort, including the relative subsurface distributions of
the pollutants and their respective concentrations.
After reviewing the data and maps, it was determined that the cost of investigation and
remediation would be extensive and could not be accurately measured. Timely restoration
of the affected aquifer is unlikely because
• The contaminants are migrating along the bottom of the aquifer. DNAPL com-
pounds are slightly denser than water and when present at a sufficient concen-
tration may sink through the water column as they migrate by advection in the
downgradient direction of groundwater flow. The location of contaminants at the
bottom of the aquifer renders remedial methods more difficult and costly.
• The COC are DNAPL VOCs, and these substances do not degrade quickly.
According to historical chemical usage records, DNAPL VOCs have not been
used in more than 25 years. Since the highest concentrations detected were more


Search WWH ::

Custom Search