Environmental Engineering Reference
In-Depth Information
Site
boundary
Site
boundary
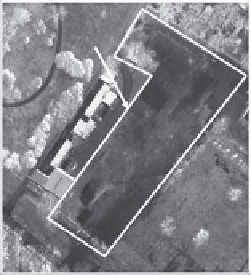
Pre-demolition
Post-demolition
FIGURE 14.2
Pre- and post-demolition site maps (=site boundary).
Operations at the facility ceased in 2001 and the buildings were demolished in 2007.
Figure 14.2 shows pre- and post-demolition aerials of the site.
Buildings were demolished to
• Lower carrying cost.
• Minimize trespass liabilities.
• Assist in evaluating potential sources of contamination. There had been more than
10 expansions conducted during facility history. Historical engineering drawings
indicated numerous potential sources and many were not available for inspec-
tion. These sources included former pits, sumps, floor drains, tanks, and chemical
storage areas. The historical map shown in Figure 14.3 was one of the many older
maps consulted that aided with the assessment of the site by identifying potential
sources of leaks and spills.
• Lower investigation cost by providing unobstructed access to all potential areas
of concern (AOCs).
• Minimize the potential of not properly investigating all potential contaminant
sources.
A Phase I environmental site assessment (Phase I ESA) was conducted and identified more
than 20 recognized environmental conditions (RECs). Figure 14.4 depicts the identified
RECs, and when this map is compared with the historical map of Figure 14.3 it demon-
strates a concentration of RECs along the building fringes—locations frequently used for
sumps, pits, and trenches.
A Phase II subsurface investigation confirmed the presence of contamination. COC
included manganese in soil and groundwater, PAHs in soil and PAH-free product float-
ing on top of groundwater, and DNAPL VOCs in soil and groundwater. Subsequent
Phase II investigations confirmed the presence of a significant DNAPL VOC groundwa-
ter plume. However, the results of the Phase II also indicated the presence of multiple
DNAPL VOC plumes, with at least one of the groundwater plumes originating from an
upgradient source. This finding indicated a broader regional assessment of groundwater
and potential sources must be conducted—a task made easier by an accurate geologic
map. Figure 14.5 shows the available geologic map for the area near the site.

Search WWH ::

Custom Search