Environmental Engineering Reference
In-Depth Information
generating facilities, and some factories trigger the production of ground-level ozone
(Figure 7.29; USEPA 2009e). This variety of ozone is a concern in urban regions of the
United States during the summer, because strong sunlight and hot weather can generate
higher levels (USEPA 2009e).
Since the Clean Air Act of 1990, atmospheric ozone concentration in the United States
has declined 25% (USEPA 2008a). Better control of stationary and mobile sources of air pol-
lution such as automobile exhaust is behind this improvement (USEPA 2008a).
8.4.6.11 Sulfur Dioxide
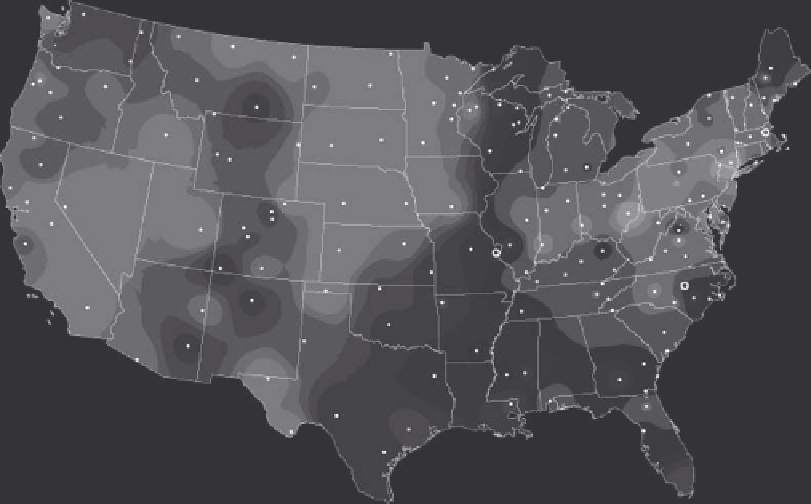
Sulfur dioxide is a component of smog, and it also combines with nitrous oxide compounds
to eventually form sulfuric acid—commonly referred to as acid rain (USEPA 2008a). It is
removed from the atmosphere during precipitation and is neutralized quickly in soil if
the pH of the soil is greater than 7. Some areas of the northeastern United States have soils
lacking the ability to effectively neutralize the effects of acid rain, and there have been
adverse effects on aquatic life and vegetation in the region. Efforts to reduce sulfur dioxide
emissions from stationary and mobile sources have resulted in a decrease of 71% since
1980 in the United States (USEPA 2008a). Nevertheless, the pH of rain in the eastern United
States remains acidic (Figure 8.25; NADP 2009).
8.4.6.12 Particulate Matter
Urban areas have the highest concentrations of particulate matter, which is a significant
distributor of contaminants in the atmosphere. Contaminants such as SVOCs, some VOCs,
5.4
5.0
5.1
5.1
5.2
5.1
5.1
5.2
5.4
4.8
5.2
5.7
5.4
5.2
5.3
5.9
4.9
5.3
5.3
5.2
5.2
5.3
4.7
4.5
4.6
5.2
5.3
5.7
4.6
5.0
5.0
4.6
5.2
5.2
4.8
4.7
4.6
4.5
4.7
4.7
5.4
5.2
4.5
4.5
4.5
4.6
4.6
5.1
5.2
4.7
4.7
4.5
5.6
4.8
5.5
4.5
5.3
5.2
5.3
5.3
5.2
4.3
5.1
5.0
4.7
4.6
5.1
4.6
5.1
4.4
4.6
4.4
4.5
4.5
4.6
5.2
4.4
4.5
4.5
6.0
6.2
5.3
4.6
4.5
4.5
5.6
5.9
5.0
5.5
4.3
4.6
4.6
4.4
4.6
4.4
4.7
5.5
4.7
5.2
5.1
4.5
4.6
5.5
4.9
4.7
5.6
5.1
5.2
4.6
4.6
5.2
4.7
4.7
4.7
4.7
4.7
5.3
4.9
4.6
4.9
4.6
4.9
4.7
4.6
4.5
4.6
4.7
4.7
4.6
4.7
4.9
Field pH
≥5.3
5.2-5.3
5.1-5.2
5.0-5.1
4.9-5.0
4.8-4.9
4.7-4.8
4.6-4.7
4.5-4.6
4.4-4.5
4.3-4.4
<4.3
5.4
5.1
4.3
5.3
4.6
4.8
5.0
5.0
5.3
4.6
5.0
5.0
4.8
4.7
5.3
5.1
4.7
4.8
4.9
4.7
4.9
4.7
4.8
5.4
4.6
Sites not pictured:
AK01
AK03
4.9
5.2
5.3
5.0
4.6
5.0
5.3
4.7
5.0
5.1
FIGURE 8.25
(See color insert.)
pH of precipitation in the United States in 2004. (From National Oceanic and Atmospheric
Administration (NOAA), Atmospheric CO2 at Mauna Loa observatory, http://www.esrl.noaa.gov/gmd/ccgg/
trends/co2_data_mlo.html (accessed November 11, 2009), 2009.)

Search WWH ::

Custom Search