Environmental Engineering Reference
In-Depth Information
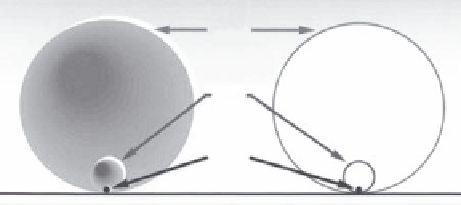
Sand
Silt
Clay
FIGURE 4.16
Relative size difference between a sand, silt, and clay particle. (From United States Department of Agriculture,
From the surface down. An introduction to soil surveys for agronomic use, Washington, DC, http://ftp-fc.egov.
usda.gov/NSSC/Educational_Resources/surdown.pdf (accessed July 4, 2010), 2010a.)
Soil textural triangle
100
90
80
70
Clay
60
50
Silty
clay
Sandy
clay
40
Silty
clay loam
Clay loam
30
Sandy clay loam
20
Loam
Silt loam
Sandy loam
10
Loamy
sand
Silt
Sand
Sand separate, %
FIGURE 4.17
Soil textural chart. (From United States Department of Agriculture, Guide to texture by feel, http://soils.gov/
education/resources/lessons/texture (accessed July 4, 2010), 2010b.)
describe soils on a consistent basis (USDA 2010b). Figure 4.18 is a useful guide when using
the textural chart shown in Figure 4.17, and Figure 4.19 contains the guidelines used to
describe many properties of soil (Virginia Department of Transportation 2003).
Consistency
refers to the relative ease a sediment can be deformed. There are various
methods for determining consistency, but in the field, consistency can be estimated using

Search WWH ::

Custom Search