Environmental Engineering Reference
In-Depth Information
20.30
19.58
20.73
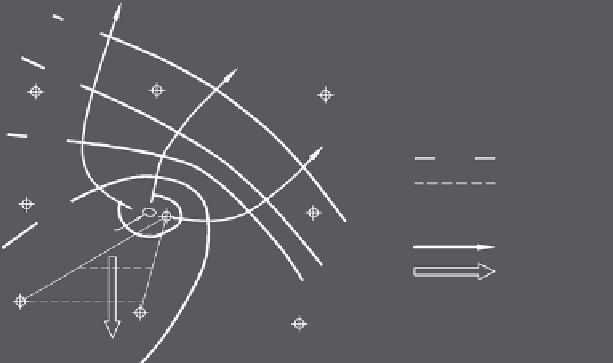
Groundwater elevation contour (m)
19.00
(Actual)
(Inferred)
21.43
22.10
Groundwater flow direction
20.42
Area of leaking
water line
22.00
21.8
(Actual)
(Inferred)
21.6
28.34
21.60
21.53
FIGURE 3.52
Anthropogenic influence on groundwater flow.
Figure 3.52 presents a situation where three monitoring wells do not provide a large
enough well network to evaluate the direction of groundwater flow. This number was not
enough because the presence of a leaking pipe from a potable water source modified the
natural groundwater flow pattern (OEPA 1995).
An additional example of anthropogenic influence on groundwater is presented in
Figure 3.53. In this case, an industrial site in the Midwest overlies groundwater within a
fine- to medium-grained lacustrine sand beach deposit. Groundwater is encountered at a
depth of less than 3 m (10 ft) beneath the surface and is anthropogenically influenced in
two ways: (1) storm sewers were installed at a depth below the water table and (2) founda-
tions for the buildings were constructed to depths below the water table. Equal potential
lines or groundwater contours are identified on the figure with a contour interval of 0.3 m
(1 ft). Groundwater flow on the western portion of the figure is toward the east but as
groundwater flows across the site, it is interrupted.
Flow interruption occurred where the groundwater migrated along the out-casing of
the storm sewers because they were backfilled with a coarse gravel. Gravel is much more
permeable than the naturally occurring geologic formation and groundwater leaked into
the storm sewers through joints and cracks. The contaminants dissolved in groundwa-
ter followed the anthropogenic pathway to migrate to a potentially sensitive ecological
habitat—in this case, the storm sewers discharge to a lake containing a trout population.
As identified in Figure 3.53, there are three locations where groundwater enters the storm
drain, each identified as 1, 2, and 3. In addition, the groundwater flow lines are spaced
relatively close together along the western (left side of figure) site boundary and are dis-
rupted toward the eastern (right side of figure) indicating that the building foundations
have influenced groundwater flow across the site.
3.7.2.3 Artificial Recharge
Artificial groundwater recharge
is defined as the practice of increasing by artificial
means the amount of water that enters an aquifer and has been performed in the United
States for over 50 years (Todd 1959). This definition has been expanded to include direct
recharge of groundwater for potable sources through spreading basins, pits, and injection
Search WWH ::

Custom Search