Database Reference
In-Depth Information
Mosq3 Larvae
Julian Date
Spring
Mosq3 Oviposition Rate
Mosq3 L Death
Adjusting
Mos3DD
Standing Water
M3 LS Larvae
Mosq3 Adults
Mosq3 Adults
Mosq3 Hatching
Ovipositing
Mosq3 Eclosing
Mosq3 Eggs
Mosq3 Larvae
Mos3DD
Mosq3 Death
M3 LS Egg
Mosq3 Egg #
M3 LS Adult
Mosq3 Egg Mortality
M3 LS Adult
Low
Mos3DD
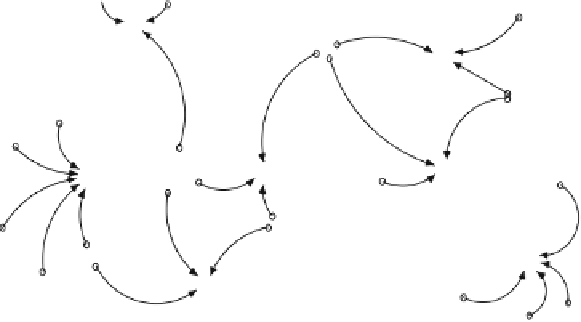
Fig. 5.3
threshold. Research on mosquito development
3
indicated that species differ in the
proportion of their total life span spent in each age class. Some species spend over
half their life as larvae while others have very short larval periods relative to their
total life span (as measured in degree days). We believe this may be an important
component of examining transmission with respect to the period of time when stand-
ing water is available in the environment. A short larval period allows for very quick
response to the availability of breeding sites. Consequently, we chose to define mos-
quito development by the duration of the larval period as a proportion of the entire
life span. We then assumed that egg duration is one-third the remaining life span
and adult duration is two-thirds the remaining life span. The model can be refined,
as more becomes know about the life span of particular mosquitoes.
Although there is evidence that arboviruses like St. Louis encephalitis and West
Nile are present in other vertebrates (domestic horses, raccoons, and even reptiles),
the titers detected in bird populations correspond best to the transmission of the
disease to humans. Passeriforme (warblers, jays, crows, etc.) and Columbiforme
(pigeons and doves) orders are specifically identified in the geographical spread and
the amplification of the virus during the summer months
4
. We developed a simple
seasonal reproduction bird model for susceptible birds assuming that most repro-
duction occurs on or around the spring equinox (Julian Date = 80). Avian repro-
duction appears to be timed to this annual date. Mortality begins immediately as an
exponential decrease of the population at a rate that yields approximately the same
bird population by Julian Date 80 of the following year (Figure 5.4). The popula-
tions and rates in this portion of the model are necessarily speculative and should
3
See footnote 2.
4
See footnote 2.