Database Reference
In-Depth Information
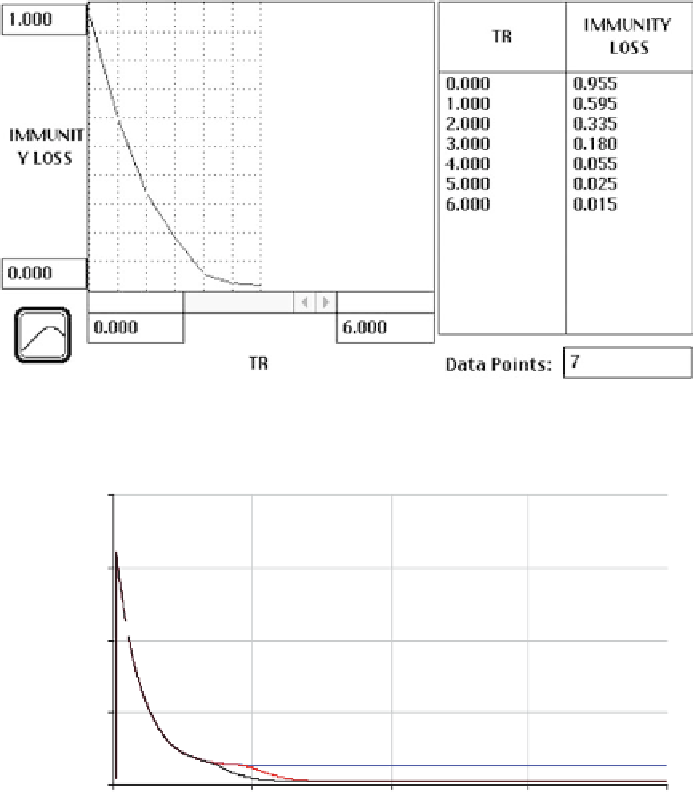
Fig. 4.5
INFECTED POP:
1 -
2 -
3 -
1:
30000000
1
1:
15000000
2
3
1
1
1
2
3
2
3
2
3
1:
0
0.00
50.00
100.00
150.00
200.00
Time
Fig. 4.6
being bitten, their loss of immunity is low (Figure 4.5). The death rate of infected
people is higher than the natural rate, especially among children. We use an average
death rate for different cohorts to calculate the death rate of infected people.
Let us now explore a set of scenarios for this model. In the first scenario, we
assume a value for HBI = 0.0005 and set the value for repellents = 10. This means
a small biting rate vector. For this, we change the vector control between 0.1 (very
low control of vectors, and thus high survival rate of vectors) and 1.2 (high control
of vectors, and thus low survival rate of vectors). The results are shown in Figure 4.6