Database Reference
In-Depth Information
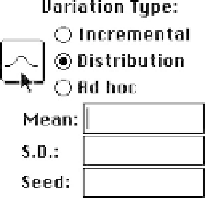
Fig. 2.11
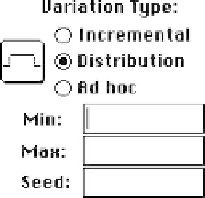
Fig. 2.12
Section 2.2. If you do not wish to make use of the normal distribution of the random
numbers used in the sensitivity analysis, click on the bell curve button.
This button will change its appearance (Figure 2.12), and you now need to specify
a minimum, maximum, and seed for your sensitivity analysis.
A final choice for the specification of sensitivity runs in STELLA is not to change
parameters in incremental intervals or along distributions. You can specify
ad hoc
values for each of the consecutive runs.
TWO POPULATION EPIDEMIC MODEL
INFECTED(t)
=
INFECTED(t
−
dt)
+
(GET SICK
−
SURVIVE
−
DIE) * dt
INIT INFECTED = 1
INFLOWS:
GET SICK
=
CONTACT RATE * NON IMMUNE * INFECTED
+
CONTACT RATE 1 2 * NON IMMUNE * INFECTED 2
OUTFLOWS:
SURVIVE
=
SURVIVAL RATE * INFECTED
DIE
SURVIVAL RATE) * INFECTED
INFECTED 2(t)
=
(1
−
=
INFECTED 2(t
−
dt)
+
(GET SICK 2
−
DIE 2
−
SURVIVE 2) * dt
INIT INFECTED 2
=
20
INFLOWS:
GET SICK 2
=
CONTACT
RATE 2 * INFECTED 2 * NON IMMUNE 2