Database Reference
In-Depth Information
GET SICK
NON IMMUNE
INFECTED
DIE
BIRTHS
SURVIVE
CONTACT RATE
SURVIVAL RATE
NON IMMUNE 2
INFECTED 2
GET SICK 2
DIE 2
BIRTHS 2
SURVIVE 2
SURVIVAL RATE 2
CONTACT RATE 2
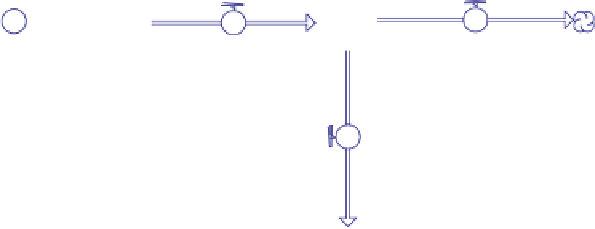
Fig. 2.8
between the two populations. You can “automate” this process by choosing Sensi
Specs under the Run pull-down menu. Then select CONTACT RATE 1 2 to learn
how sensitive the model results are to different parameter values. Select Incremental
and specify the start value for your sensitivity analysis as .001 and your end value
as 0.0014. If the number of sensitivity runs is set to 3, then STELLA will run the
model first with the start value, second with a value that lies equidistant between
your start and end value (i.e. 0.0012 in our case), and last with the end value you
specified. Click OK. Then run the model. Note how STELLA now shows S-Run in
the Run pull-down menu to indicate that this will be a sensitivity run. The results
are shown in Figure 2.10. The first two runs yield period outbreaks of the disease,
where the second run shows less frequent but more severe outbreaks. Also, while
the severity of the outbreaks for the first run slightly declines in the long term, it
increases for the second run. In contrast to these results, the disease disappears for
the third model run. The contact rate for interactions between the two populations
is so high that the disease “burns out” after the first outbreak.
If you wish for a sensitivity analysis to let parameters vary from run to run
along a normal distribution with known mean and standard deviation, choose the
“Distribution” option (Figure 2.11) instead of “Incremental.” When you specify
“Seed” as a positive integer, you ensure the ability to replicate a particular ran-
dom number sequence in subsequent sensitivity runs, just like we have done in