Database Reference
In-Depth Information
INFLOWS:
STAY IN BED
=
CONTAGIOUS
{
Individuals per Time Period
}
OUTFLOWS:
RECOVER
=
.9*SICK
{
Individuals per Time Period
}
DIE
=
.1*SICK
{
Individuals per Time Period
}
CONTACT RATE
=
.000002
{
1/(Number of Contagious
+
Sick) *
Nonimmune) per Time Period
}
2.2 Epidemic Model with Randomness
Let us assume for the model of the previous section that the contact rate at any given
week may be somewhere between .000001 and .000003. Thus, instead of fixing
the contact rate to .000002, as we have done before, we now let it vary randomly
between its two extremes. The built-in function RANDOM can be used to specify
the contact rate accordingly. Open CONTACT RATE and choose RANDOM from
the list of built-in functions, or type it into the dialog box. Then specify the upper
and lower bounds, separating the entries by a comma. The model should now read:
CONTACT RATE = RANDOM
(
.
000001
,.
000003
)
(2.2)
The rest of the model should stay the same, as in Figure 2.1. Will this change in
model specification significantly affect the periodicity or severity of the epidemic
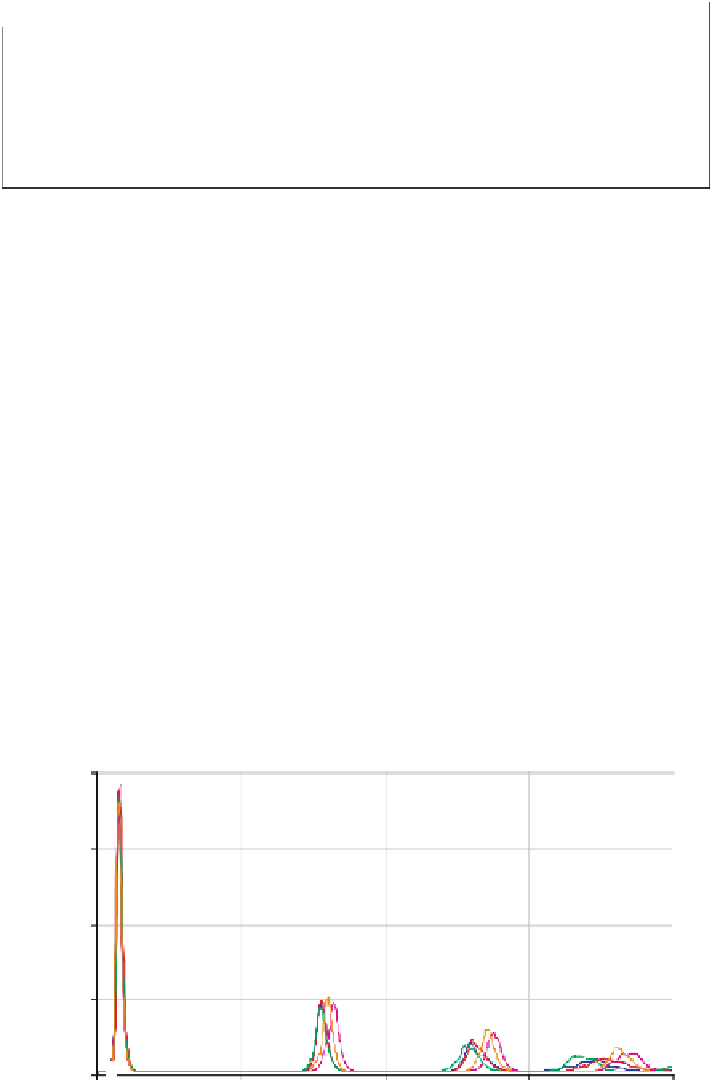
outbreaks? See the results in Figure 2.3 and note that the behavior of the disease is
virtually the same for the first outbreak of the disease, but that the randomness of
the contact rate has a much more noticeable impact for smaller outbreaks, which on
SICK:
1 -
2 -
3 -
4 -
5 -
1:
300000
1:
150000
4
1
4
2
3
2
3
4
5
1
2
3
5
1
2
3
5
1
4
5
1:
0
0.00
75.00
150.00
225.00
300.00
Weeks
Fig. 2.3