Database Reference
In-Depth Information
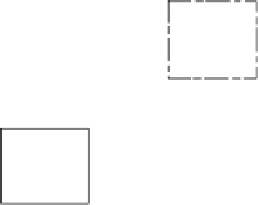
create
cellular
model
model
trasnslator
S T E L L A
S T E L L A
define
inter-cell
variable
movemnt
compile
r u n
S M E
S M E
S M E
map
preparation
output
G R A S S
G R A S S
Fig. 15.6
maps for the area of concern. The GIS maps in our case referenced land-use condi-
tions in Illinois that were used to develop fox carrying capacities in each of 1,610
cells that describe the state. Georeferenced maps were also used for the initial in-
troduction of three diseased foxes along the state's eastern boundary (the disease
appears to be spreading from east to west in the United States). The model collec-
tion is then run on a workstation computer for a model run-time of 25 years.
15.2.7 Cellular Model
A simplified STELLA model of fox population dynamics is shown in Figure 15.7.
The four main variables measured—adult foxes, juvenile foxes, adult sick foxes, and
juvenile sick foxes are represented as stock variables. The flow variables regulate
the additions and subtractions to the stocks that take place at each time step (in this
model, one month) and the rate variables help determine the amount of flow and
changes in the flow variables. For the population dynamics model, flows and rates
include: births of juvenile foxes, a death rate for each stock, emigration (out of)
and immigration (into) each stock from adjoining cells, and a maturation of juvenile
foxes into adulthood. A more detailed explanation of the model follows.
Details of the fox birth rates, maturation rates, infection rates, mortality rates,
and migration rates are given in Deal et al. (2000)
38
.
38
Deal, B., C. Farello, M. Lancaster, T. Kompare and B. Hannon. 2000. A Dynamic Model of
the Spatial Spread of an Infectious Disease: The Case of Fox Rabies in Illinois, Environmental
Modeling and Assessment, Vol. 5, pp. 47-62.