Database Reference
In-Depth Information
R
B
0
1/2
Q
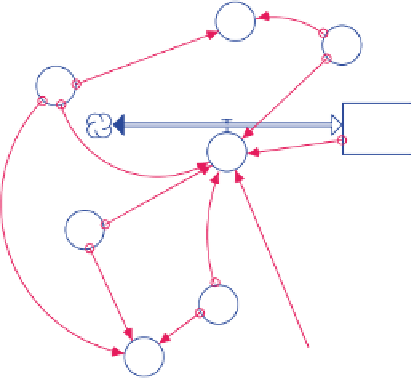
Fig. 14.7
Q
K
K1
B
²B
GR
C
R
S
Fig. 14.8
For KS = 2.5, the corresponding values of X are 0.69, 2.0, and 7.32. These cor-
respond to B = 0.173, 0.500, and 1.83, respectively (see equation (14.12)). These
B values represent the steady states of B. However, only two of these extrema are