Database Reference
In-Depth Information
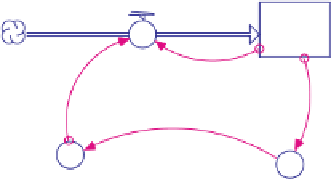
another converter called AWARENESS LEVEL. This level is a function of the num-
ber of SICK, let's say, equal to 0.1 times the number of SICK. This AWARENESS
LEVEL then affects the CONTAGION RATE, the greater the awareness of the dis-
ease as determined by the sheer number of SICK, the lower the CONTAGION RATE
(Figure 1.11).
SICK
GETTING SICK
?
CONTAGION RATE
AWARENESS LEVEL
Fig. 1.11
Open CONTAGION RATE. Click on the required input AWARENESS LEVEL.
The relationship between AWARENESS LEVEL and CONTAGION RATE must be
specified in mathematical terms, or at least, you must make an educated guess about
that relationship. An educated guess about the relationship between two variables
can be expressed by plotting a graph that reflects the anticipated effect one variable
(AWARENESS LEVEL) will have on another (CONTAGION RATE). The feature
used for this is called a
graphical function
.
To use a graph to delineate the extended relationship between CONTAGION
RATE and AWARENESS LEVEL, open CONTAGION RATE and enter AWARE-
NESS LEVEL as the graph driver. Click on “Become Graphical Function” and set
the limits on the AWARENESS LEVEL at 0 and 10. Set the corresponding limits
on the CONTAGION RATE at 0 and 0.10, to represent a change in this rate when
the AWARENESS LEVEL is between 0 and 10. (These are arbitrary numbers for a
made-up model.) Finally, use the mouse arrow to draw a curve from the maximum
CONTAGION RATE an AWARENESS LEVEL of 0 to the point of 0 birth rate an
AWARENESS LEVEL of 10.
Suppose a survey of the AWARENESS LEVEL and CONTAGION RATE were
taken at three points in time. The curve you just drew goes through all three points.
You can assume that, if a census had been taken at other times, it would show a
gradual transition through all the points (Figure 1.12). This sketch is good enough
for now. Click on OK.
Before you run the model again, consider what the results will be. Think of the
graph for SICK through time. Generally, it should rise, but not in a straight line. At
first the rise should be steep: the initial population is only 10, so the initial CONTA-
GION RATE should be high. Later it will slow down. Then, the population should
level off at 100 (10 times the maximum AWARENESS LEVEL), when SICK would