Database Reference
In-Depth Information
DZ
MORTALITY
RATE
TRANSMISSION
EFFICACY
DEATH
RATE
PROPORTION
SUSCEPTIBLE
DEATH
RATE
PROPORTION
INFECTED
DEATH
RATE
+
BIRTH
RATE
+
R DYING
S DYING
I DYING
INFECTION
RATE
RECOVERING
NUMBER
RECOVERED
NUMBER
INFECTED
NUMBER
SUSCEPTIBLE
BIRTHING
INFECTING
+
TOTAL
POPULATION
RECOVERY
RATE
PROPORTION
RECOVERED
+
LOSING
IMMUNITY
IMMUNITY
LOSS RATE
Fig. 12.2
for the study of limited disease outbreaks, expansion of the SIR model to dynami-
cally changing populations allowed for the study of more complex disease dynamics
where addition of new susceptible individuals can change predictions about disease
persistence (Figure 12.2).
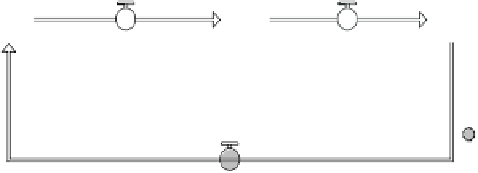
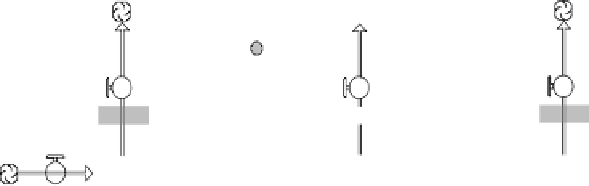
Whether population-dynamic or population-static, in an SIR model each stock
holds the number of individuals of a certain disease status—the NUMBER SUS-
CEPTIBLE to infection with the disease, the NUMBER INFECTED and capable
of passing the disease to others, and the NUMBER RECOVERED from the disease
(a state often assumed to be immune to re-infection for some period of time or per-
manently, depending on the disease). Rates of transition between susceptible and
infected status depend on the TRANSMISSION EFFICACY—or what proportion
of contacts between susceptible and infected individuals result in transmission of
the disease—and the rate of contact between infected and susceptible individuals,
which is determined by multiplying the proportions of individuals in the INFECTED
and SUSCEPTIBLE categories. BIRTHING and DYING are built into the model as
a simple density independent growth equation where each compartment has a back-
ground DEATH RATE. In this model, we assume a disease that causes only mor-
bidity (not mortality) so the DZ MORTALITY RATE is set to zero. Should we wish
to model a fatal disease, then the death rate for the infected individuals would be
elevated from the population's average DEATH RATE to the background DEATH
RATE plus the DZ MORTALITY RATE.
Some disease outbreaks may be temporally or spatially limited such that popula-
tion level changes have little effect on the epidemic. For example, an influenza out-
break at a convalescent center or hospital may reasonably be modeled in terms of a
closed population of potentially exposed individuals who transition through suscep-
tible, infected, and resistant status. The outbreak ends when the relative proportion