Database Reference
In-Depth Information
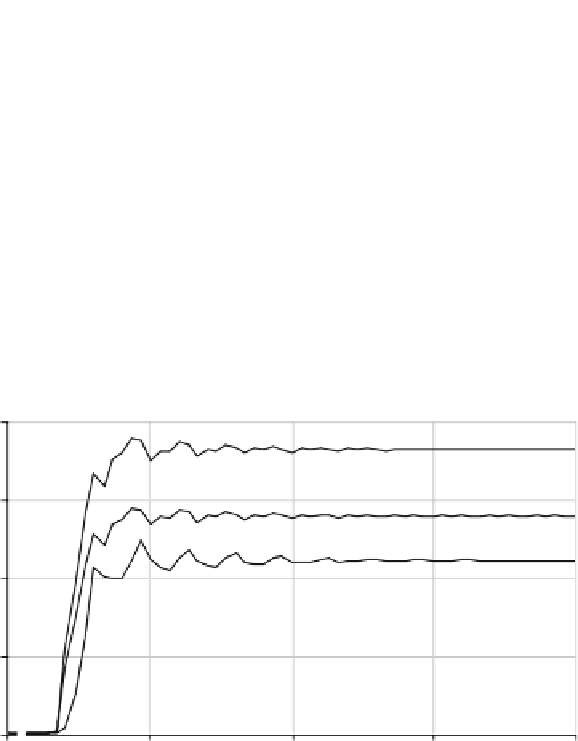
1: ADULT 1
2: ADULT 2
3: ADULT 3
4: JUVENILE
1:
2.53e+08
2:
2.23e+08
3:
1.90e+08
4:
2.78e+08
2
1
1
4
4
2
3
4
2
3
1
3
4
1:
1.27e+08
2:
1.12e+08
3:
9.48e+07
4:
1.39e+08
1:
0.00
2:
0.00
3:
0.00
3
1
2
4:
0.00
0.00
15.00
30.00
45.00
60.00
Months
Fig. 10.5
1: POPULATION DENSITY
2: TOTAL POPULATION
3: LAKE TURNOVER
1:
1100.00
2:
8.50e+08
3:
0.60
2
2
2
1
1
1
3
3
3
1:
550.00
2:
4.25e+08
3:
0.30
3
1:
0.00
2:
91.00
1
2
3:
0.00
0.00
15.00
30.00
45.00
60.00
Months
Fig. 10.6
Similarly, lake turnover (Figure 10.6) closely follows the population pattern since
lake turnover is directly related to the number of zebra mussels in the lake, but it is
slightly lagged. Lake turnover peaks in year fourteen at 0.37 (total lake turnover per
day) and stabilizes at 0.33. This variable is more intuitive if presented as the number
of days required for the mussel population to filter the entire volume of the lake. In
the peak of the base case, year fourteen, the mussel population filters the volume of
the lake in 2.69 days. This rate changes as population drops and stabilizes at 2.99
days/turnover.