Database Reference
In-Depth Information
1: Sick 1
2: Sick 2
3: Sick 3
4: Sick 4
5: Sick 5
1:
120
2:
3:
4:
5:
1:
2:
3:
60
4:
1
1
5:
1
2
2
1
2
2
1:
2:
3
3:
3
3
3
4:
4
4
4
4
5
5
5
5
0
5:
1825.00
3650.00
5475.00
7300.00
0.00
Days
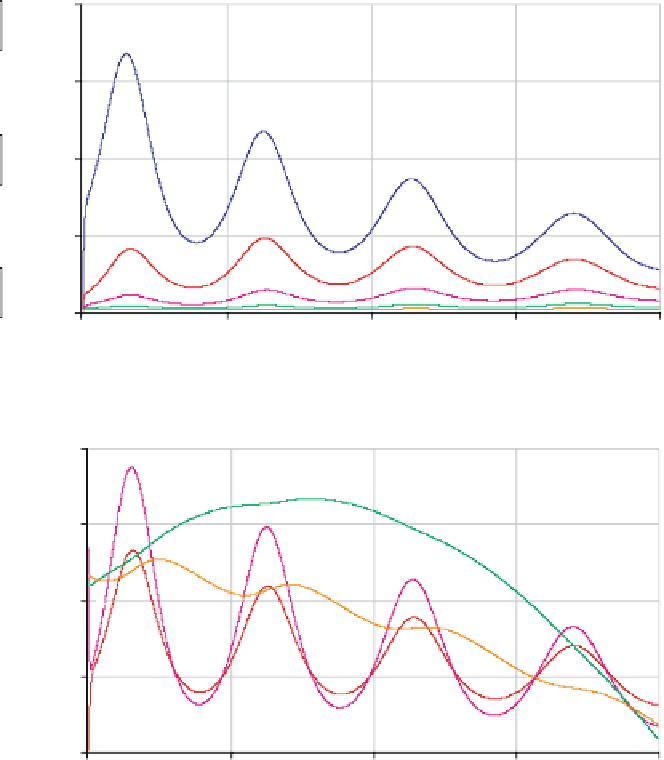
Fig. 8.2
1: Shingles
2: Total Sick
3: Total Infective
4: Total Population
5: Total Immune
1:
1
2:
200
3:
70
4:
247500
5:
225000
4
4
2
4
1:
0
5
3
2
2:
100
1
1
1
1
3:
40
4:
245500
5
2
5:
215000
3
3
3
2
5
4
1:
−
1
5
2:
0
10
3:
243500
4:
5:
205000
0.00
1825.00
3650.00
5475.00
7300.00
Days
Fig. 8.3
Model results without immunization and without the effects of shingles (i.e. the
“shingle rate” set to zero instead of 0.15), are shown in Figure 8.2 for the first five
cohorts. The sixth cohort—individuals of 50 years and older—are virtually unaf-
fected by chicken pox over the simulated 20-yeartimeframe. Overall, the number
of individuals sick from chicken pox declines, in part because the population in
the long run is declining (Figure 8.3). As the population ages and no vaccination
takes place, older parts of the population are relatively more affected by chicken
pox (Figure 8.3), and the average age of first infection increases (Figure 8.4).