Database Reference
In-Depth Information
LARVAE SURV RATE
TOTAL ACTIVE NYMPHS YEAR
WEEKLY LARVAL TICK BURDEN
TOTAL ACTIVE NYMPHS OUT
LARVAE DEATH
TOTAL ACTIVE NYMPHS IN
LARVAE ACTIVE
LARVAE FED
NYMPHS ACTIVE
N DEATH
LARVAE FEED
LARVAE MOLT
EGG HATCH
LARVAE FED DEATH
NYMPH SURVIVAL RATE
N FEED
EGG SURVIVAL
EGGS
EGG FAILURE
WEEKLY NYMPH TICK BURDEN
LARVAE SURV RATE
NYMPH FED DEATH
NYMPH FED
EGG ENVIRONMENTAL FACTOR 2
EGG EMERGENCE RATE
N MOLT
EGG REST FAILURE
NYMPH SURVIVAL RATE
EGG ENVIRONMENTAL FACTOR
EGGS REST
ADULT UNFED DEATH
ADULT UNFED
EGG OVIPOSITION
EGG FECUNDITY
EGG MAX
ADULT FEED RATE
ADULT SURVIVAL RATE
ADULT FEMALE POPULATION RATIO
ADULT REST
ADULT FED
ADULT OVIPOSITION
WEEKLY ADULT TICK BURDEN DEER
ADULT OVIPOSITION DEATH RATE
ADULT EMERGENCE RATE
ADULT REST RATE
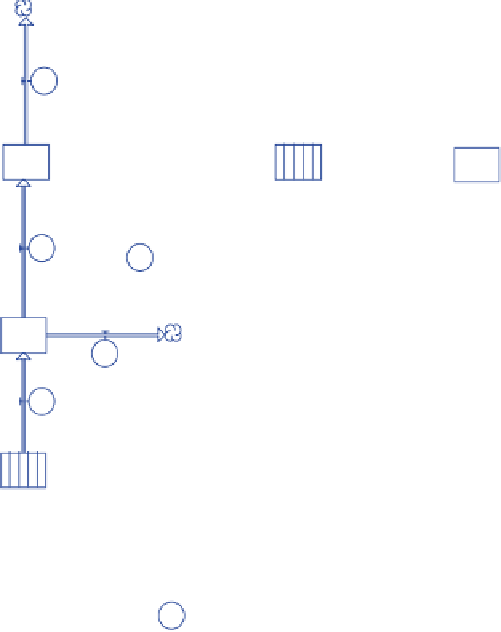
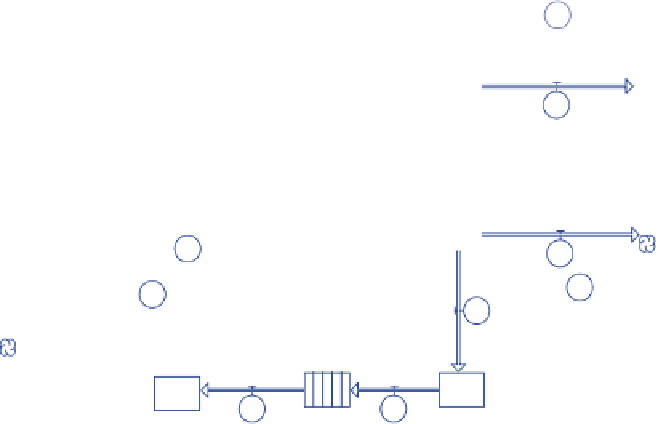
Fig. 7.14
life stage. Conveyors have been used to simulate the rest periods. Additionally, we
assumed that intermediate and definitive host densities account for the carrying ca-
pacity and feeding success of the tick stages dependent on a blood meal to molt.
Figures 7.15-7.17 show, respectively, the populations of larvae, nymphs, and
adult ticks. The latter indicates that the adult tick population numbers are not yet
limited by deer numbers.
Now that all the pieces of the model are in place, we can calculate the number of
active tick nymphs. By accumulating the number of ticks that are successfully molt-
ing from larval to nymphal form, we set up a reservoir that can provide the number
of active nymphs per year. This variable can then be compared to the magnitude of
the acorn mast index 2 years prior to see if the hypothesis holds true.