Database Reference
In-Depth Information
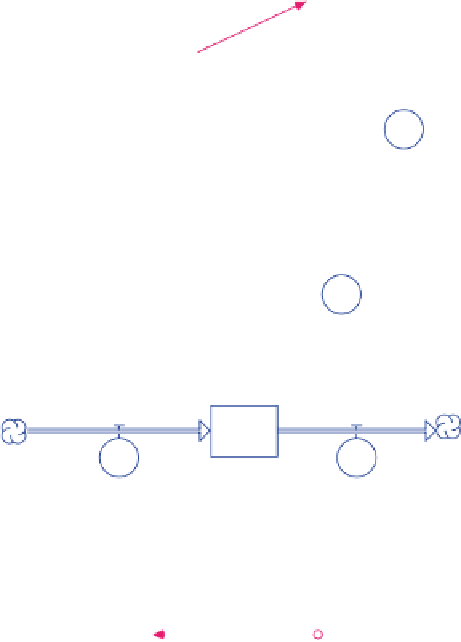
WHITE OAK ACORN MAST
WHITE OAK PROPORTION
WHITE OAK AMP RATE
THREE YEAR COUNTER
WEEK COUNTER
TWO YEAR COUNTER
TOTAL ACORN MAST
BLACK OAK AMP RATE
BLACK OAK PROPORTION
BLACK OAK ACORN MAST
ACORN MAST STORE NUMBER
ACORN MAST INDEX
~
ACORN MAST STORE IN
ACORN MAST STORE OUT
TOTAL ACORN MAST
MOUSE NEXT SUMMER POP DENSITY
WEEK COUNTER
Fig. 7.1
Based on the work by Wolff, we used a linear regression equation that relates the
summer white-footed mouse density (mice per hectare) to the acorn mast index:
SUMMER MOUSE POPULATION DENSITY
=
7
.
28
+
0
.
60
∗
ACORN MAST INDEX
(7.1)
Thus, the minimum mouse population density is 7.28, and mouse population density
increases with an increase in the acorn mast index.
The mouse population dynamics are based on the acorn mast index (Figure 7.3).
In order to use the above equation, we assumed the summer mouse population den-
sity to be the carrying capacity (K) for mice. Additionally, the reason for the increase
in population (N) during the summer following a large mast event is due to an ad-
ditional litter being born in the winter. White-footed mouse females generally have