Information Technology Reference
In-Depth Information
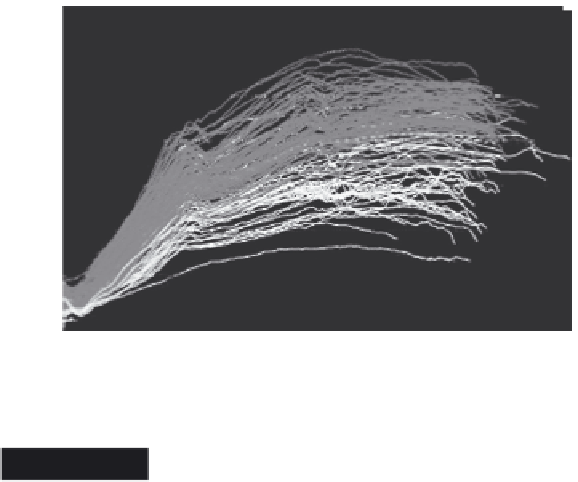
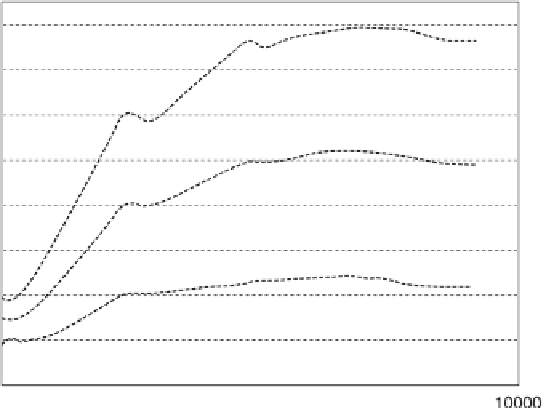
assure that all three variables spanned the same range. Figure 4.6
represents a batch control chart generated with the PC1 values for
the spraying phase of the granulation. Different colors of batches
are related to production period (blue - spring, red - summer). This
kind of process analysis allows interpretation of otherwise unknown
sources of variability in the process (e.g. production time).
Furthermore, it was demonstrated that granule size distribution on
average was related to process trajectories followed for each
particular batch. The PLS model was developed to quantify the
observed relation between process trajectories (from MRT
monitoring) and fi nal granule particle distributions. Good correlation
with experimental data was obtained.
Batch control chart (reprinted from Lourenço
et al., 2011; with permission from Elsevier)
Figure 4.6
4.4 References
Amigo, J.M., Surribas, A., Coello, J., Montesinos, J.L., Maspoch, S., and Valero,
F. (2008) 'On-line parallel factor analysis. A step forward in the monitoring
of bioprocesses in real time',
Chemometr. Intell. Lab.
, 92(1): 44-52.


Search WWH ::

Custom Search