Environmental Engineering Reference
In-Depth Information
No feedback
1
p
φ
a
0.8
p
φ
φ
0.6
φ
0.4
p
φ
0.2
φ
0
0
0.2
0.4
0.6
0.8
1
σ
Positive feedback
p
φ
b
0.25
0.2
φ
0.15
p
φ
p
φ
0.1
φ
0.05
φ
0.05
0.1
0.15
0.2
0.25
σ
Negative feedback
1
p
φ
c
0.9
p
φ
φ
0.8
φ
p
φ
0.7
φ
0.6
0.05
0.1
0.15
0.2
0.25
σ
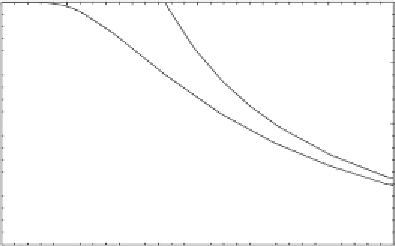
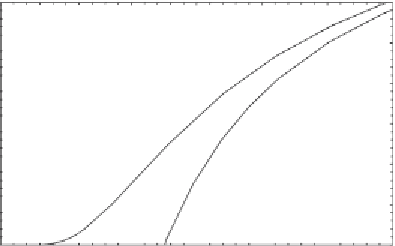
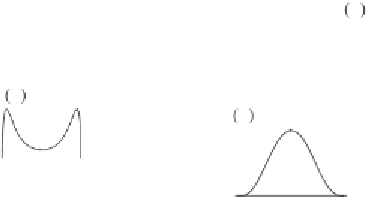
Figure 3.9. Shapes of the probability distributions of
φ
as functions of the parameters
σ
and
α
(see text for details): (a) no feedback (
b
=
0
,θ
0
=
1
.
1
,
q
∗
=
1), (b) positive
feedback (
b
=−
0
.
5
,θ
0
=
1
.
25
,
q
∗
=
1), and (c) negative feedback (
b
=
0
.
5
,θ
0
=
0
.
75
,
q
∗
=
1).


Search WWH ::

Custom Search