Environmental Engineering Reference
In-Depth Information
2
β
4
p
φ
p
φ
φ
φ
β
β
p
φ
p
φ
φ
β
φ
β
k
β
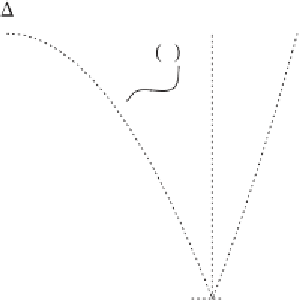
Figure 3.2. Possible shapes of the steady-state pdf for the Verhulst model with
additive dichotomous noise as functions of the switching rate
k
and noise ampli-
tude
.
upper boundary of the domain. When the switching rate decreases, the pdf becomes
less and less peaked in
, another noise-induced transition
occurs: The shape of the pdf dramatically changes in that it exhibits an antimode
corresponding to the deterministic steady state. Finally, for even lower transition rates
(i.e., long residence times of the noise in the two states of the DMN), the two modes
are at the domain boundaries. All these transitions are due to noise autocorrelation,
which is inversely proportional to
k
and is accounted for by the fourth term in Eq.
(
3.3
). As the autocorrelation increases, the DMN persists longer in each of its two
states, and
φ
=
β
, until, for
k
=
β
φ
is more likely to reach a state close to the boundaries of the domain
before the DMN switches to the other state. This leads to a bimodal behavior with
modes coinciding with the boundaries. Figure
3.3
shows some examples of these
nonobvious effects of the additive noise in the Verhulst model.
p
(φ)
8
6
4
2
φ
0.8
0.9
1
1.1
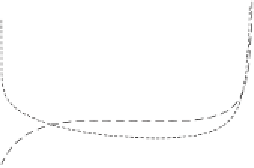
Figure 3.3. Examples of pdf's for theVerhulst model with additive dichotomous noise
for
β
=
=
.
=
,
.
1 and
0
2. Continuous, dashed, and dotted curves refer to
k
2
0
8,
and 0.4, respectively.


Search WWH ::

Custom Search