Environmental Engineering Reference
In-Depth Information
p
φ
p
φ
1.5
0.8
0.6
1
0.4
0.5
0.2
φ
φ
2
1
1
2
2
1
1
2
(a)
(b)
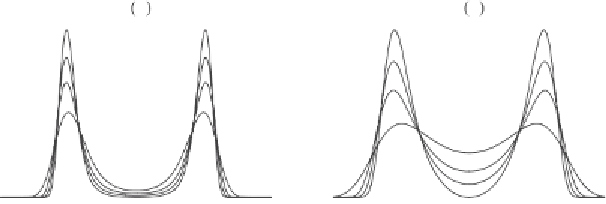
Figure 2.16. Effect of the noise correlation on the Ginzburg-Landau system forced by
an O-U process: (a)
s
ou
=
0
.
1, (b)
s
ou
=
0
.
5. In each panel the four curves correspond
to
τ
ou
=
0 (i.e., white noise),
τ
ou
=
0
.
3,
τ
ou
=
0
.
6, and
τ
ou
=
0
.
99; the peaks become
more pronounced when the noise correlation increases.
[i.e., Eq. (
2.102
)]. Therefore the effective range of validity of Fox's expression is not limited
only to small values of
τ
ou
.
In conclusion, both Eqs. (
2.104
)and(
2.106
)[or(
2.102
)] give good results even for
moderate-to-large-correlation scales. However, Eq. (
2.104
) requires small values of
s
ou
, whereas (
2.106
) requires that condition (
2.107
) be satisfied.
Figure
2.16
shows an example of effect of colored noise on the dynamics of
φ
.
4
2
The model refers to the case of a bistable potential
V
(
φ
)
=
φ
/
4
−
φ
/
2drivenby
an additive O-U process,
ξ
ou
(
t
), i.e., the so-called Ginzburg-Landau model:
d
d
t
=
φ
−
φ
3
+
ξ
ou
(
t
)
.
(2.108)
p
φ
p
φ
1
1.5
0.8
1
0.6
0.4
0.5
0.2
φ
1.5
φ
1.5
1
0.5
0.5
1
1.5
1.5
1
0.5
0.5
1
(a)
(b)
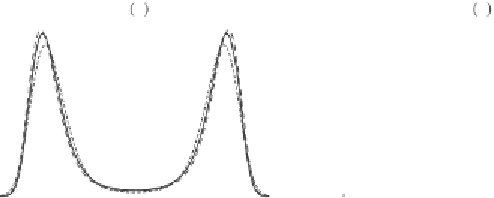
Figure 2.17. Comparison among different approximations of steady-state pdf for
a system driven by the O-U process: small-correlation expansion [Eq. (
2.103
),
dashed curve], decoupling approximation [Eq. (
2.104
), dotted curve], and UCNA
[Eq. (
2.106
), continuous curve]. (a)
τ
ou
=
.
τ
ou
=
.
9(
s
ou
=
.
0
3, (b)
0
0
1 in both panels).


Search WWH ::

Custom Search