Environmental Engineering Reference
In-Depth Information
v
st
1
0.8
0.6
0.4
0.2
0
D
0.1
0.2
0.3
0.4
Figure 6.3. Steady-state average woody biomass as a function of the diffusion coef-
ficient for
0001. These results
are obtained from the numerical solution of Eq. (
6.10
). Figure taken from
D'Odorico
et al.
(
2007b
).
α
=
0
.
45,
λ
0
=
0
.
65,
b
/λ
0
=−
0
.
9,
ω
0
=
0
.
4,
=
0
.
v
1
0.8
0.6
0.4
0.2
1000
t
200
400
600
800
(a)
v
1
0.8
0.6
0.4
0.2
1000
t
200
400
600
800
(b)
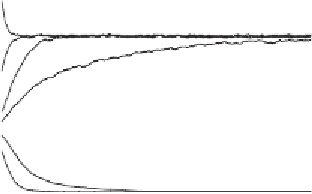
Figure 6.4. Numerical simulation (in a 128
128 grid) of the temporal evolution
of mean tree biomass as a function of the initial condition for (a)
D
×
=
0
.
1 and
(b)
D
3; the other parameters are the same as in Figure
6.3
. Figure taken from
D'Odorico et al.
(
2007b
).
=
0
.


Search WWH ::

Custom Search