Environmental Engineering Reference
In-Depth Information
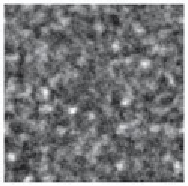
Figure 5.50. Examples of field described by the CDIMA reaction modeled by Eqs.
(
5.105
) and (
5.106
). The three fields refer to the noise intensity
s
gn
equal to 0.001, 0.2,
and 0.6, respectively (
t
=
60 time units in all cases). The parameters are
a
=
16
,
b
=
301
,
c
=
0
.
6,
d
=
1
.
07, and ¯
ϕ
=
0
.
35. In this case the critical
ϕ
value is
ϕ
c
=
2
.
3
(
Sanz-Anchelergues et al.
,
2001
)
thereby allowing the system to explore the patterned condition. Thus we can expect
an intermediate level of spatiotemporal noise to induce the emergence of patterns
even in subthreshold conditions, i.e., when the control parameter has not reached the
bifurcation point.
An example is given by the model (
Carrillo et al.
,
2004
)
∂φ
4
φ
φ
1
1
2
2
=
−
φ
−
1
−
ϕ
+∇
φ
,
a
c
(5.105)
1
1
∂
t
2
1
+
φ
b
c
2
∂φ
2
∂
φ
1
φ
2
1
2
t
=
φ
−
1
+
ϕ
+
D
∇
φ
,
(5.106)
1
2
+
φ
where
is a control parameter. Originally
proposed to describe the photosensitivity of the CDIMA reaction (CDIMA stands for
chlorine dioxide iodide malonic acid), this model has an homogeneous stable state
[
φ
1
and
φ
2
are the state variables and
ϕ
2
1
φ
1
,
st
=
(
a
−
5
ϕ
)
/
5
c
and
φ
2
,
st
=
a
(1
+
φ
st
)
/
5
φ
1
,
st
] that becomes unstable to spatial
,
perturbation when
ϕ
is lower than a given critical value
ϕ
c
, which depends on the
system's parameters. When
ϕ<ϕ
c
, a Turing instability occurs and a pattern with a
nonzero wave number appears.
We consider the case in which the mean level of the control parameter ¯
ϕ
=
0
.
35 is
greater than
ϕ
c
- i.e., the homogeneous steady state is deterministically stable - and it
is disturbed by a random white Gaussian noise with intensity
s
gn
. Figure
5.50
shows
the possible scenarios associated with different noise intensities: If the noise intensity
is low, the crossings of the bifurcation point are rare and the field remains fairly
homogeneous (see the left-hand panel of Fig.
5.50
). In contrast, when the noise is
suitably tuned on intermediate intensities, spatiotemporal stochastic coherence occurs
and evident spatial patterns emerge (central panel of Fig.
5.50
). Finally, when the noise
intensity further increases, these patterns are again destroyed by the noise.


Search WWH ::

Custom Search