Environmental Engineering Reference
In-Depth Information
p
d
f
p
d
f
p
d
f
1
1
60
30
0.0
φ
2
φ
2
φ
0.02
2
2
S
S
S
1
150
150
0.5
3
k
3
k
3
k
1
2
1
2
1
2
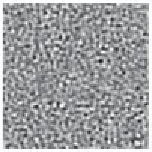
Figure 5.38. Example of patterns resulting from the numerical simulation of model
(
5.73
) under the Stratonovich interpretation. The boundary conditions are periodic.
The columns refer to 0, 50, and 100 time units. The parameters are
a
=
1,
c
=
1,
k
0
=
1,
D
=
40, and
s
gn
=
10.
p
d
f
p
d
f
p
d
f
0.7
0.7
60
30
0.0
φ
2
φ
2
φ
0.02
2
2
S
S
S
1
350
350
0.5
3
k
3
k
3
k
1
2
1
2
1
2
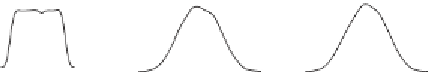
Figure 5.39. The same as Fig.
5.38
, but under the Ito interpretation.


Search WWH ::

Custom Search