Environmental Engineering Reference
In-Depth Information
0.9
30N
0.8
20N
0.7
0.6
10N
0.5
EQ
0.4
10S
0.3
0.2
20S
0.1
0
30S
(a)
(b)
40S
<
20W
10W
0
10E
20E
30E
40E
50E
20W
10W
0
10E
20E
30E
40E
50E
>
40N
0.8
30N
0.7
20N
0.6
10N
0.5
EQ
0.4
10S
0.3
20S
0.2
30S
0.1
<
(c)
(d)
40S
20W
10W
0
10E
20E
30E
40E
50E
20W
10W
0
10E
20E
30E
40E
50E
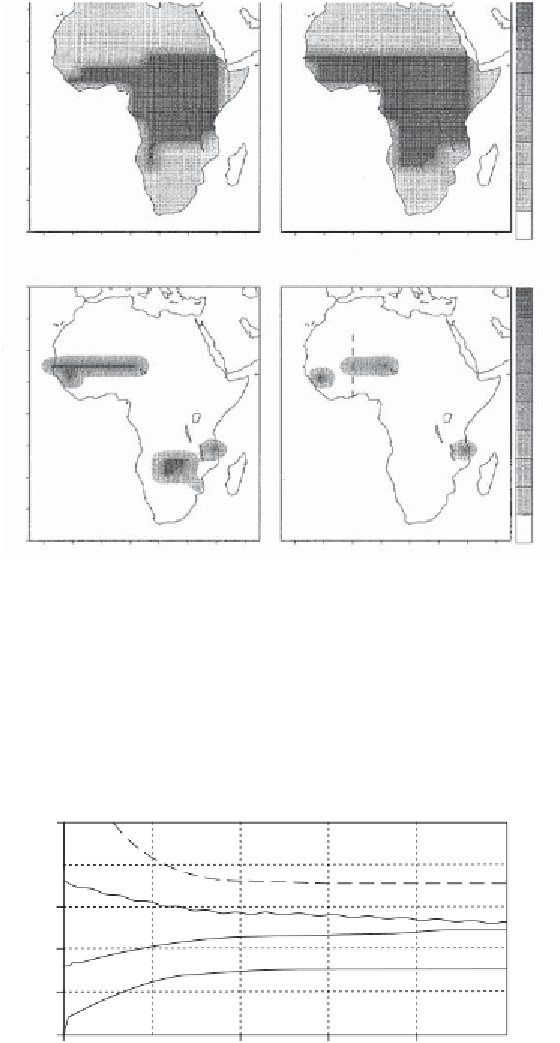
Figure 4.4. Equilibrium vegetation distribution from a coupled atmosphere-
vegetation model. Dark shaded areas correspond to forest cover. Light gray areas
correspond to sparse vegetation and desert conditions. (a) Simulation starting from
desert (i.e., unvegetated) conditions in the whole African continent; (b) simulation
starting with forest vegetation across the whole continent; (c) map of the difference
between (b) and (a); (d) difference between equilibrium vegetation (obtained with
fluctuating SST and initial desert conditions) and the equilibrium state in (a) (after
Zeng and Neelin
,
2000
).
v
1
0.8
FOREST
FOREST_INTERANNUAL
0.6
0.4
DESERT_INTERANNUAL
0.2
DESERT
0
t
Figure 4.5. Average vegetation cover in the Sahel region as a function of time.
Calculated with model simulations using different initial conditions (after
Zeng and
Neelin
,
2000
).
(yrs)
50
150
200
0
100
Search WWH ::

Custom Search