Environmental Engineering Reference
In-Depth Information
t
1
(a)
t
2
(b)
t
3
(c)
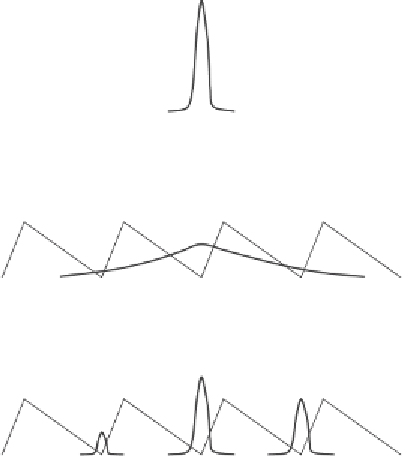
Figure 3.29. Schematic representation of noise-induced transport. At time
t
1
the
noise is weak and particles are concentrated in the well A. When the noise becomes
dominant (time
t
2
), particles spread across the potential barriers. Finally, when the
noise is again reduced (time
t
3
), the asymmetry of the potential means that particles
tend to accumulate more in the well located to the right of well A. Thus a net positive
current
˙
φ
occurs.
where
A
<
1 and sign(
·
)isthe
signum function
[i.e., sign(
z
)
=
1if
z
>
0; sign(
z
)
=
−
0]. Equation (
3.75
) expresses a steplike behavior, with noise intensity
jumping between 2
s
gn
T
(1
1if
z
<
A
)and2
s
gn
T
(1
/2. It is possible
to demonstrate (
Reimann
,
2002
) that, in this case, for a large set of parameters,
+
−
A
) every half-period
T
˙
φ
=
.
0
(3.76)
These conditions are associated with the occurrence of net transport.
To understand the physical mechanisms causing net transport, we consider the case
in which (i)
T
(1
T
(1
V
is the height of the potential
barrier (defined as in Fig.
3.17
), and (ii) the noise intensity has a period
−
A
)
V
+
A
), where
greater than
the time scale of the intrawell deterministic dynamics (see Subsection
3.3.1
). Under
these conditions, the dynamics of
T
can be schematized as an alternation of the three
phases, sketched in Fig.
3.29
: When the noise level is low, the deterministic component
of the dynamics prevails. Thus the values of
φ
tend to concentrate in correspondence
to the minima of the potential [see Fig.
3.29
(a)]. Conversely, during the phase with
high noise levels, the dynamics are dominated by the random component, whereas
the shape of the potential has only a weak effect on the process. In these conditions
φ

Search WWH ::

Custom Search